
Temperature–entropy diagram
| Thermodynamics |
|---|
 |


In thermodynamics, a temperature–entropy (T–s) diagram is a thermodynamic diagram used to visualize changes to temperature (T ) and specific entropy (s) during a thermodynamic process or cycle as the graph of a curve. It is a useful and common tool, particularly because it helps to visualize the heat transfer during a process. For reversible (ideal) processes, the area under the T–s curve of a process is the heat transferred to the system during that process.[1]
Working fluids are often categorized on the basis of the shape of their T–s diagram.
An isentropic process is depicted as a vertical line on a T–s diagram, whereas an isothermal process is a horizontal line.[2]

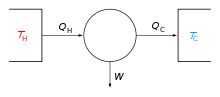
For reversible processes, such as those found in the Carnot cycle:
QC = the amount of energy exchanged between the system and the cold reservoir
QH = W + QC = heat exchanged with the hot reservoir. η = W / (QC + QH) = thermal efficiency of the cycleIf the cycle moves in a clockwise sense, then it is a heat engine that outputs work; if the cycle moves in a counterclockwise sense, it is a heat pump that takes in work and moves heat QH from the cold reservoir to the hot reservoir.

See also
- Carnot cycle
- Pressure–volume diagram
- Rankine cycle
- Saturation vapor curve
- Working fluid
- Working fluid selection
References
- ^ "Temperature Entropy (T–s) Diagram - Thermodynamics - Thermodynamics". Engineers Edge. Retrieved 2010-09-21.
- ^ "P–V and T–S Diagrams". Grc.nasa.gov. 2008-07-11. Retrieved 2010-09-21.