1985 Cornwall County Council election
| ||||||||||||||||||||||||||||||||||||||||||||||||||||||||||||||||||||
All 79 seats of Cornwall County Council 40 seats needed for a majority | ||||||||||||||||||||||||||||||||||||||||||||||||||||||||||||||||||||
|---|---|---|---|---|---|---|---|---|---|---|---|---|---|---|---|---|---|---|---|---|---|---|---|---|---|---|---|---|---|---|---|---|---|---|---|---|---|---|---|---|---|---|---|---|---|---|---|---|---|---|---|---|---|---|---|---|---|---|---|---|---|---|---|---|---|---|---|---|
| ||||||||||||||||||||||||||||||||||||||||||||||||||||||||||||||||||||
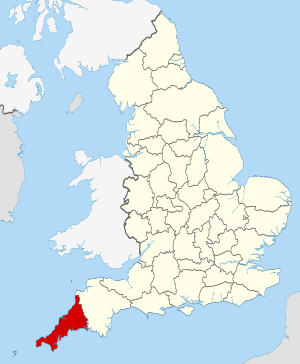
 The County of Cornwall within England | ||||||||||||||||||||||||||||||||||||||||||||||||||||||||||||||||||||
| ||||||||||||||||||||||||||||||||||||||||||||||||||||||||||||||||||||
The 1985 Cornwall County Council election for the Cornwall County Council was held on 2 May 1985, as part of the wider 1985 local elections.[2]
Results
| Party | Seats | Gains | Losses | Net gain/loss | Seats % | Votes % | Votes | +/− | |
|---|---|---|---|---|---|---|---|---|---|
| Alliance | 30 | 38.0 | 32.7 | 35,064 | |||||
| Independent | 27 | 34.2 | 30.6 | 32,850 | |||||
| Conservative | 16 | 20.3 | 23.7 | 25,382 | |||||
| Labour | 5 | 6.3 | 9.2 | 9,842 | |||||
| Mebyon Kernow | 1 | 1.3 | 2.0 | 2,134 | |||||
| Residents | 0 | 0.0 | 1.1 | 1,196 | |||||
| Ecology | 0 | 0.0 | 0.2 | 791 | |||||
| Cornish Nationalist Party | 0 | 0.0 | 0.3 | 305 | New | ||||
| Ind. Conservative | 0 | 0.0 | 0.2 | 183 | New | ||||
| Independent Liberal | 0 | 0.0 | 0.1 | 93 | New | ||||
| BNP | 0 | 0.0 | 0.1 | 70 | New | ||||
References
- ^ "Local Election Summaries 1985". The Elections Centre. Retrieved 21 June 2019.
- ^ a b Local Election Results 1985: Cornwall, p.127
