
File:US Effective Corporate Tax Rate 1947-2011 v2.jpg
US_Effective_Corporate_Tax_Rate_1947-2011_v2.jpg (764 × 452 pixels, file size: 67 KB, MIME type: image/jpeg)
Summary
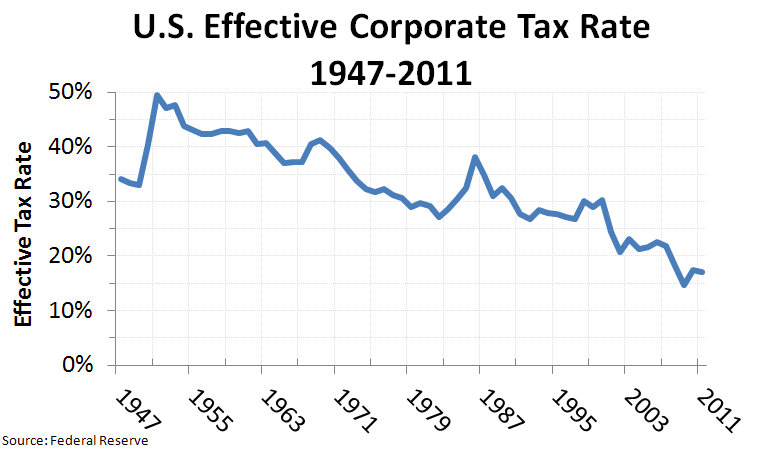
| Description | English: U.S. effective corporate tax rates, 1947–2012 |
| Date | |
| Source | Own work |
| Author | Guest2625 |
Original Source: St. Louis Federal Reserve Bank, FRED® Economic Data, "Graph: Federal Government: Tax Receipts on Corporate Income (FCTAX)/(Corporate Profits After Tax (CP)+Federal Government: Tax Receipts on Corporate Income (FCTAX))"
Weblink: http://research.stlouisfed.org/fred2/graph/?g=aWA
See also original wikiupload by: Cupco
Weblink: http://commons.wikimedia.org/wiki/File%3AUS_effective_corp_tax_rate_1947-2012.png
Based on: Between The Balance Sheets blog, where graph was created "by combining the Corporate Profits After Tax data from the NIPA tables with the OMB’s data on the revenue collected by the corporate profit tax. The sum of these two series ought to equal total pre-tax profits (roughly), so from there it is easy to calculate the average effective tax rate."
Compare to this FRED graph of identical annual data.
Weblink: http://betweenthebalancesheets.wordpress.com/2011/10/06/a-few-issues-with-u-s-corporate-tax-policy/
Licensing
- You are free:
- to share – to copy, distribute and transmit the work
- to remix – to adapt the work
- Under the following conditions:
- attribution – You must give appropriate credit, provide a link to the license, and indicate if changes were made. You may do so in any reasonable manner, but not in any way that suggests the licensor endorses you or your use.
- share alike – If you remix, transform, or build upon the material, you must distribute your contributions under the same or compatible license as the original.
File history
Click on a date/time to view the file as it appeared at that time.
| Date/Time | Thumbnail | Dimensions | User | Comment | |
|---|---|---|---|---|---|
| current | 03:30, 26 September 2012 | | 764 × 452 (67 KB) | Guest2625 | User created page with UploadWizard |
File usage
The following 9 pages use this file:
Global file usage
The following other wikis use this file:
- Usage on es.wikipedia.org
- Usage on it.wikipedia.org
- Usage on vi.wikipedia.org