New York's 19th congressional district
| New York's 19th congressional district | |
|---|---|
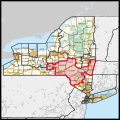
Interactive map of district boundaries since January 3, 2025 | |
| Representative | |
| Distribution |
|
| Population (2023) | 769,461 |
| Median household income | $65,983[2] |
| Ethnicity |
|
| Cook PVI | D+1[3] |
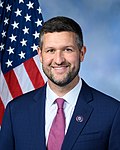
New York's 19th congressional district is a congressional district for the United States House of Representatives located in New York’s Catskills, Hudson Valley, greater Capital District, Southern Tier, and Finger Lakes regions. It lies partially in the northernmost region of the New York metropolitan area and mostly south of Albany. This district is represented by Democrat Josh Riley.
Various New York districts have been numbered "19" over the years, including areas in New York City and various parts of upstate New York. The 19th District was a Manhattan-based district until 1980. It then was the Bronx-Westchester seat now numbered the 17th District. The present 19th District was the 21st District before the 1990s, and before that was the 25th District.
The 2020 redistricting saw the district expand to include the entirety of Broome, Tioga, Tompkins, Chenango, Delaware, Greene, Sullivan, and Columbia Counties, while partially including Ulster and Otsego Counties.[4]
Recent election results from statewide races
| Year | Office | Results[5] |
|---|---|---|
| 2008 | President | Obama 54% - 44% |
| 2012 | President | Obama 55% - 45% |
| 2016 | President | Trump 48% - 46% |
| Senate | Schumer 61% - 36% | |
| 2018 | Senate | Gillibrand 58% - 42% |
| Governor | Molinaro 50% - 44% | |
| Attorney General | James 51% - 46% | |
| 2020 | President | Biden 51% - 47% |
| 2022 | Senate | Schumer 50% - 49% |
| Governor | Zeldin 53% - 46% | |
| Attorney General | Henry 52% - 48% | |
| Comptroller | DiNapoli 52% - 48% | |
| 2024 | President | Harris 51% - 49% |
| Senate | Gillibrand 54% - 45% |
History
- 1873–1875
- Montgomery
- 1913–1983
- Parts of Manhattan
- 1983–1993
- Parts of Bronx, Westchester
- 1993–2003
- All of Putnam
- Parts of Dutchess, Orange, Westchester
2003–2013

- All of Putnam
- Parts of Dutchess, Orange, Rockland, Westchester
From 2003 to 2013, the 19th was composed of parts of Dutchess, Orange, Rockland, and Westchester Counties, in addition to the entirety of Putnam County. Much of this district is now the 18th district, while the current 19th is essentially a merger of the former 20th district and 22nd district.
2013–2023

After redistricting in 2012, the 19th district comprised all of Columbia, Delaware, Greene, Otsego, Schoharie, Sullivan, and Ulster Counties; and parts of Broome, Dutchess, Montgomery, and Rensselaer Counties. The district borders Vermont, Massachusetts, and Connecticut to the east; and Pennsylvania to the southwest. Democratic President Barack Obama won the new district by 6.2% in 2012, while Republican Donald Trump won the district by 6.8% in 2016.
Incumbent Representative Nan Hayworth opted to follow most of her constituents into the new 18th district in 2012, but she was defeated by Democrat Sean Patrick Maloney, a former advisor to President Bill Clinton.[6] Most of the 2003-13 19th district became part of the 2013-23 18th district.[7] Meanwhile, incumbent 20th district representative Chris Gibson ran for re-election in the new 19th district and won. On January 5, 2015, per his pledge when elected not to serve more than 4 terms, Gibson announced that he would not run for re-election in 2016.[8]
In 2016, Democrat Zephyr Teachout was defeated by Republican John Faso in the election.[9] In 2018, Faso was defeated after only 1 term by Democrat Antonio Delgado. In 2022, Delgado resigned to become Lieutenant Governor, leaving the seat vacant. Democrat Pat Ryan won the special election to complete Delgado's term on August 23, 2022.[10]
This iteration of the district was a presidential bellwether for the duration of its existence, having voted for the winner in each election from 2012 to 2020.[11]
2023–present
Ryan ran in the 18th district in the November 2022 general election due to redistricting, while Democrat Josh Riley, who ran in the Democratic primary, lost to Republican Marc Molinaro in the 19th district.[12] In the November 2024 general election, Josh Riley defeated current representative Marc Molinaro.[13] Molinaro refused to concede until the last ballots are counted, despite AP's decision that he has no path to victory.[14]
Counties, towns, and municipalities
For the 119th and successive Congresses (based on the districts drawn following the New York Court of Appeals' December 2023 decision in Hoffman v New York State Ind. Redistricting. Commn.), the district contains all or portions of the following counties, towns, and municipalities.[15][16]
Broome County (23)
- All 23 towns and municipalities
Chenango County (29)
- All 29 towns and municipalities
Columbia County (23)
- All 23 towns and municipalities
Cortland County (10)
- Cincinnatus, Freetown, Harford, Lapeer, Marathon (town), Marathon (village), Solon, Taylor, Virgil, Willet
Delaware County (28)
- All 28 towns and municipalities
Greene County (19)
- All 19 towns and municipalities
Otsego County (34)
- All 34 towns and municipalities
Rensselaer County (13)
- Berlin, Brunswick (part; also 20th), Castleton-on-Hudson, East Greenbush, East Nassau, Grafton, Nassau (town), Nassau (village), Petersburgh, Poestenkill, Sand Lake, Schodack, Stephentown
Sullivan County (21)
- All 21 towns and municipalities
Tompkins County (16)
- All 16 towns and municipalities
Ulster County (12)
- Denning, Ellenville, Gardiner (part; also 18th), Hardenburgh, Hurley, Marbletown, Olive, Rochester, Rosendale, Shandaken, Shawangunk, Wawarsing
List of members representing the district
Election results
Note that in New York State electoral politics there are numerous minor parties at various points on the political spectrum. Certain parties will endorse either the Republican or Democratic candidate for every office, hence the state electoral results contain both the party votes, and the final candidate votes (Listed as "Recap").
| Party | Candidate | Votes | % | ±% | |
|---|---|---|---|---|---|
| Republican | Sue W. Kelly (incumbent) | 102,142 | 46.3 | ||
| Democratic | Richard S. Klein | 86,926 | 39.4 | ||
| Conservative | Joseph J. DioGuardi | 27,424 | 12.4 | ||
| Independence | William E. Haase | 4,104 | 1.9 | ||
| Majority | 15,216 | 6.9 | |||
| Turnout | 220,596 | ||||
| Party | Candidate | Votes | % | ±% | |
|---|---|---|---|---|---|
| Republican | Sue W. Kelly (incumbent) | 104,467 | 62.2 | +15.9 | |
| Democratic | Dick Collins | 56,378 | 33.6 | −5.8 | |
| Right to Life | Joseph J. DioGuardi | 5,941 | 3.5 | +3.5 | |
| Freedom Party | Charles C. Williams | 1,046 | 0.6 | +0.6 | |
| Majority | 48,089 | 28.7 | +21.8 | ||
| Turnout | 167,832 | −23.9 | |||
| Party | Candidate | Votes | % | ±% | |
|---|---|---|---|---|---|
| Republican | Sue W. Kelly (incumbent) | 145,532 | 60.9 | −1.3 | |
| Democratic | Lawrence Otis Graham | 85,871 | 35.9 | +2.3 | |
| Right to Life | Frank X. Lloyd | 4,086 | 1.7 | −1.8 | |
| Green | Mark R. Jacobs | 3,662 | 1.5 | +1.5 | |
| Majority | 59,661 | 24.9 | −3.8 | ||
| Turnout | 239,151 | +42.5 | |||
| Party | Candidate | Votes | % | ±% | |
|---|---|---|---|---|---|
| Republican | Sue W. Kelly (incumbent) | 121,129 | 70.0 | +9.1 | |
| Democratic | Janine M. H. Selendy | 44,967 | 26.0 | −9.9 | |
| Right to Life | Christine M. Tighe | 4,374 | 2.5 | +0.8 | |
| Green | Jonathan M. Wright | 2,642 | 1.5 | −0.0 | |
| Majority | 76,162 | 44.0 | +19.1 | ||
| Turnout | 173,112 | −27.6 | |||
| Party | Candidate | Votes | % | ±% | |
|---|---|---|---|---|---|
| Republican | Sue W. Kelly (incumbent) | 175,401 | 66.7 | −3.3 | |
| Democratic | Michael Jaliman | 87,429 | 33.3 | +7.3 | |
| Majority | 87,972 | 33.5 | −10.5 | ||
| Turnout | 262,830 | +51.8 | |||
| Party | Candidate | Votes | % | ±% | |
|---|---|---|---|---|---|
| Democratic | John Hall | 100,119 | 51.2 | +17.9 | |
| Republican | Sue W. Kelly (incumbent) | 95,359 | 48.8 | −17.9 | |
| Majority | 4,760 | 2.4 | −31.1 | ||
| Turnout | 195,478 | −25.6 | |||
| Party | Candidate | Votes | % | ±% | |
|---|---|---|---|---|---|
| Democratic | John Hall (incumbent) | 164,859 | 58.7 | +7.5 | |
| Republican | Kieran Lalor | 116,120 | 41.3 | −7.5 | |
| Majority | 48,739 | 17.3 | 14.9 | ||
| Turnout | 280,979 | 43.7 | |||
| Party | Candidate | Votes | % | ±% | |
|---|---|---|---|---|---|
| Republican | Nan Hayworth | 109,956 | 52.5 | +11.2 | |
| Democratic | John Hall (incumbent) | 98,766 | 47.5 | −11.2 | |
| Majority | 11,190 | 5.3 | −12 | ||
| Turnout | 209,285 | −25.5 | |||
| Party | Candidate | Votes | % | ±% | |
|---|---|---|---|---|---|
| Republican | Chris Gibson | 149,763 | 52.9 | +0.4 | |
| Democratic | Julian Schreibman | 133,567 | 47.1 | −0.4 | |
| Majority | 16,196 | 5.7 | 0.4 | ||
| Turnout | 283,303 | 35.4 | |||
| Party | Candidate | Votes | % | ±% | |
|---|---|---|---|---|---|
| Republican | Chris Gibson (incumbent) | 131,594 | 62.6 | +9.7 | |
| Democratic | Sean Eldridge | 72,470 | 34.5 | −12.6 | |
| Majority | 59,124 | 28.1 | 22.4 | ||
| Turnout | 210,351 | −25.7 | |||
| Party | Candidate | Votes | % | ±% | |
|---|---|---|---|---|---|
| Republican | John Faso | 166,171 | 54.1 | −8.5 | |
| Democratic | Zephyr Teachout | 141,224 | 45.9 | +11.4 | |
| Majority | 24,947 | 6.1 | −20.0 | ||
| Turnout | 307,395 | 46.13 | |||
| Party | Candidate | Votes | % | ±% | |
|---|---|---|---|---|---|
| Democratic | Antonio Delgado | 147,873 | 51.4 | +5.5 | |
| Republican | John Faso (incumbent) | 132,873 | 46.1 | −8 | |
| Majority | 15,000 | 5.3 | −0.8 | ||
| Turnout | 287,894 | −6.3 | |||
| Party | Candidate | Votes | % | |
|---|---|---|---|---|
| Democratic | Antonio Delgado | 168,281 | 48.0 | |
| Working Families | Antonio Delgado | 22,969 | 6.6 | |
| SAM | Antonio Delgado | 850 | 0.2 | |
| Total | Antonio Delgado (incumbent) | 192,100 | 54.8 | |
| Republican | Kyle Van De Water | 151,475 | 43.2 | |
| Libertarian | Victoria Alexander | 4,224 | 1.2 | |
| Green | Steve Greenfield | 2,799 | 0.8 | |
| Total votes | 350,598 | 100.0 | ||
| Democratic hold | ||||
| Party | Candidate | Votes | % | |
|---|---|---|---|---|
| Democratic | Pat Ryan | 58,427 | 45.3 | |
| Working Families | Pat Ryan | 7,516 | 5.8 | |
| Total | Pat Ryan | 65,943 | 51.8 | |
| Republican | Marc Molinaro | 52,350 | 40.5 | |
| Conservative | Marc Molinaro | 10,602 | 8.2 | |
| Total | Marc Molinaro | 62,952 | 48.1 | |
| Write-in | 96 | 0.07 | ||
| Total votes | 128,991 | 100.0 | ||
| Democratic hold | ||||
| Party | Candidate | Votes | % | |
|---|---|---|---|---|
| Republican | Marc Molinaro | 129,960 | 45.18% | |
| Conservative | Marc Molinaro | 16,044 | 5.58% | |
| Total | Marc Molinaro | 146,004 | 50.76% | |
| Democratic | Josh Riley | 124,396 | 43.25% | |
| Working Families | Josh Riley | 17,113 | 5.95% | |
| Total | Josh Riley | 141,509 | 49.20% | |
| Write-in | 105 | 0.04% | ||
| Total votes | 287,618 | 100% | ||
| Party | Candidate | Votes | % | ||
|---|---|---|---|---|---|
| Democratic | Josh Riley | 170,049 | 45.1 | ||
| Working Families | Josh Riley | 22,598 | 6.0 | ||
| Total | Josh Riley | 192,647 | 51.1 | ||
| Republican | Marc Molinaro | 164,001 | 43.5 | ||
| Conservative | Marc Molinaro | 20,289 | 5.4 | ||
| Total | Marc Molinaro (incumbent) | 184,290 | 48.9 | ||
| Total votes | 376,937 | 100.0 | |||
| Democratic gain from Republican | |||||
See also
- List of United States congressional districts
- New York's congressional districts
- United States congressional delegations from New York
- United States House of Representatives elections in New York, 2018
Notes
- ^ "Congressional Districts | 113th 114th Congress Demographics | Urban Rural Patterns". Retrieved November 9, 2022.
- ^ "My Congressional District". Retrieved September 22, 2024.
- ^ "2025 Cook PVI℠: District Map and List (119th Congress)". Cook Political Report. April 3, 2025. Retrieved April 4, 2025.
- ^ "NYS Congressional districts 2020" (PDF).
- ^ https://davesredistricting.org/maps#viewmap::948da7ae-d2f9-48d8-a04a-433f5ff88fcd
- ^ "Elections 2012". The New York Times. Retrieved July 16, 2023.
- ^ ""Congressional District Comparison"".
- ^ Chris Gibson won't run for reelection, Politico, January 5, 2015. Retrieved March 29, 2016.
- ^ Niedzwiadek, Nick (November 9, 2016). "Faso defeats Teachout as Republicans hold NY House seats". Politico. Retrieved November 13, 2016.
- ^ "NY-19 special election: Democrat Pat Ryan defeats Republican Marc Molinaro for vacant seat".
- ^ "Just 47 House districts flipped in the last three presidential elections. What do they tell us?". Daily Kos.
- ^ Golden, Vaughn (August 24, 2022). "Riley defeats Cheney in Democratic primary for 19th Congressional District". WSKG-FM. Retrieved September 15, 2022.
- ^ "AP Race Call: Democrat Josh Riley wins election to U.S. House in New York's 19th Congressional District, beating incumbent Marcus Molinaro". AP News. November 6, 2024. Retrieved November 7, 2024.
- ^ "Molinaro won't concede NY-19 before final tally, vows to accept results". spectrumlocalnews.com. Retrieved November 7, 2024.
- ^ https://www2.census.gov/geo/maps/cong_dist/cd119/cd_based/ST36/CD119_NY19.pdf
- ^ Mahoney, Bill (February 28, 2024). "New congressional maps approved in New York". POLITICO. Retrieved April 16, 2025.
- ^ Bloom was elected January 30, 1923 for the term beginning March 4, 1923. The Biographical Directory of the United States Congress incorrectly states the beginning of his term as his election date.
- ^ "NYS Board of Elections Rep. in Congress Election Returns Nov. 4, 2008" (PDF). Retrieved December 8, 2008.
- ^ "NYS Board of Elections Rep. in Congress Election Returns Nov. 2, 2010" (PDF). Retrieved December 8, 2008.
- ^ "NYS Board of Elections Rep. in Congress Election Returns Nov. 6, 2012" (PDF). Retrieved September 25, 2013.
- ^ "NYS Board of Elections Rep. in Congress Election Returns Nov. 4, 2014" (PDF). Retrieved March 19, 2018.
- ^ "NYS Board of Elections Rep. in Congress Election Returns Nov. 8, 2016" (PDF). Retrieved March 19, 2018.
- ^ "New York 19th Congressional District Special Election Results". The New York Times. Retrieved August 23, 2022.
- ^ "New York State Unofficial Election Night Results". New York State Board of Elections. August 24, 2022. Retrieved August 24, 2022.
- ^ "Statement and Return Report for Certification for NY-11" (website). www.vote.nyc. NYC Board of Elections. Retrieved November 5, 2024.
References
- Martis, Kenneth C. (1989). The Historical Atlas of Political Parties in the United States Congress. New York: Macmillan Publishing Company.
- Martis, Kenneth C. (1982). The Historical Atlas of United States Congressional Districts. New York: Macmillan Publishing Company.
- Congressional Biographical Directory of the United States 1774–present
- 2004 House election data Clerk of the House of Representatives
- 2002 House election data "
- 2000 House election data "
- 1998 House election data "
- 1996 House election data "

