Wikipedia:Picture of the day/October 3, 2006

| |||||||
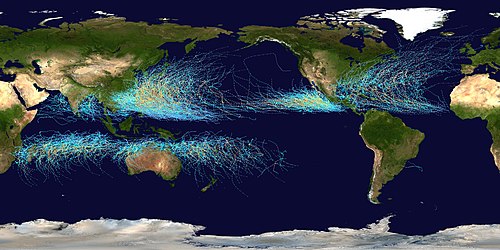
This map shows the tracks of all tropical cyclones which formed worldwide from 1985 to 2005. The points show the locations of the storms at six-hourly intervals and use the color scheme shown on the right from the Saffir-Simpson Hurricane Scale.
Diagram credit: Nilfanion | |||||||
