Vega de San Mateo
Vega de San Mateo | |
|---|---|
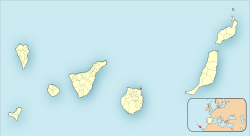
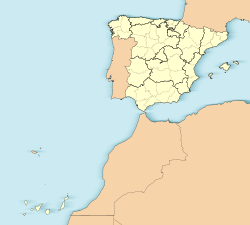
 Municipal location in Gran Canaria | |
| Coordinates: 28°0′40″N 15°32′0″W / 28.01111°N 15.53333°W | |
| Country | Spain |
| Autonomous Region | Canary Islands |
| Province | Las Palmas |
| Island | Gran Canaria |
| Area | |
• Total | 37.89 km2 (14.63 sq mi) |
| Elevation | 820 m (2,690 ft) |
| Population (2018)[2] | |
• Total | 7,625 |
| • Density | 200/km2 (520/sq mi) |
| Time zone | UTC+0 (GMT) |
| Climate | Csb |
Vega de San Mateo is a town and a municipality in the mountainous central part of the island of Gran Canaria in the Province of Las Palmas in the Canary Islands. Its population is 7,774 (2013),[3] and the area is 37.89 km2.[1] Vega de San Mateo is located 17 km southwest of Las Palmas.
Geography and climate
Vega de San Mateo is located in the center of Gran Canaria. The town is located at the foot of Pico de las Nieves, and the town is located on the windward slope, which is significantly wetter than the coastal areas.
Vega de San Mateo has a warm-summer Mediterranean climate (Köppen: Csb; Trewartha: Csbk), as the precipitation in winter is high enough, and the rainy season (October to March of the following year) accounts for 91% of the annual precipitation. The town's annual precipitation is 566.2 millimetres (22.29 in), which is about 4 to 5 times that of coastal areas. The average annual temperature is 12.9 °C (55.2 °F), of which the average temperature from April to November is greater than 10.0 °C (50.0 °F), and August is the warmest month of the year, with an average temperature of 21.0 °C (69.8 °F). From December to March is winter, and temperatures below freezing are frequent.
The annual extreme temperature ranges from −2.0 °C (28.4 °F) on 11 March 1996 to 35.7 °C (96.3 °F) on 11 July 2023.[4] January 1979 was the month with the most precipitation, with a precipitation of 979.0 millimetres (38.54 in). On the 17th of that month, the station recorded the most precipitation in history, with a precipitation of 193.4 millimetres (7.61 in).[5]
| Climate data for Vega de San Mateo Climate ID: C611E; coordinates 27°58′38″N 15°35′02″W / 27.97722°N 15.58389°W; elevation: 1,702 m (5,584 ft); 1991–2020 provisional normals, extremes 1968–present[6] | |||||||||||||
|---|---|---|---|---|---|---|---|---|---|---|---|---|---|
| Month | Jan | Feb | Mar | Apr | May | Jun | Jul | Aug | Sep | Oct | Nov | Dec | Year |
| Record high °C (°F) | 26.0 (78.8) |
23.0 (73.4) |
24.4 (75.9) |
27.0 (80.6) |
29.6 (85.3) |
32.8 (91.0) |
35.7 (96.3) |
35.0 (95.0) |
32.3 (90.1) |
30.5 (86.9) |
26.0 (78.8) |
25.0 (77.0) |
35.7 (96.3) |
| Mean daily maximum °C (°F) | 10.7 (51.3) |
11.0 (51.8) |
13.2 (55.8) |
14.6 (58.3) |
17.3 (63.1) |
21.2 (70.2) |
26.3 (79.3) |
26.1 (79.0) |
22.0 (71.6) |
18.0 (64.4) |
13.8 (56.8) |
11.9 (53.4) |
17.2 (63.0) |
| Daily mean °C (°F) | 7.3 (45.1) |
7.3 (45.1) |
9.2 (48.6) |
10.2 (50.4) |
12.5 (54.5) |
16.0 (60.8) |
20.9 (69.6) |
21.0 (69.8) |
17.3 (63.1) |
13.8 (56.8) |
10.4 (50.7) |
8.4 (47.1) |
12.9 (55.2) |
| Mean daily minimum °C (°F) | 3.9 (39.0) |
3.6 (38.5) |
5.2 (41.4) |
5.7 (42.3) |
7.7 (45.9) |
10.7 (51.3) |
15.6 (60.1) |
15.9 (60.6) |
12.5 (54.5) |
9.5 (49.1) |
7.0 (44.6) |
4.8 (40.6) |
8.5 (47.3) |
| Record low °C (°F) | −1.8 (28.8) |
−2.0 (28.4) |
−2.0 (28.4) |
−0.1 (31.8) |
−1.0 (30.2) |
0.0 (32.0) |
2.0 (35.6) |
0.2 (32.4) |
0.0 (32.0) |
0.0 (32.0) |
0.0 (32.0) |
−0.9 (30.4) |
−2.0 (28.4) |
| Average precipitation mm (inches) | 84.1 (3.31) |
82.4 (3.24) |
74.6 (2.94) |
26.0 (1.02) |
9.2 (0.36) |
1.2 (0.05) |
0.7 (0.03) |
2.3 (0.09) |
13.3 (0.52) |
55.5 (2.19) |
85.6 (3.37) |
131.5 (5.18) |
566.2 (22.29) |
| Average precipitation days (≥ 0.1 mm) | 9.81 | 9.64 | 9.20 | 7.39 | 5.08 | 1.46 | 0.68 | 1.38 | 3.44 | 8.20 | 11.92 | 11.74 | 79.94 |
| Average snowy days | 0 | 0 | 0 | 0 | 0 | 0 | 0 | 0 | 0 | 0 | 0 | 0 | 0 |
| Source: State Meteorological Agency/AEMET OpenData[4][7][8] | |||||||||||||
Historical population
|
|
See also
References
- ^ a b Instituto Canario de Estadística, area
- ^ Municipal Register of Spain 2018. National Statistics Institute.
- ^ Instituto Canario de Estadística, population
- ^ a b "Extremes (temperature)". opendata.aemet.es (in Spanish). AEMET OpenData. Archived from the original on 2024-11-26. Retrieved 26 November 2024.
- ^ "Extremes (precipitation)". opendata.aemet.es (in Spanish). AEMET OpenData. Archived from the original on 2024-11-26. Retrieved 26 November 2024.
- ^ "Weather station data". opendata.aemet.es (in Spanish). AEMET OpenData. Archived from the original on 2024-11-13. Retrieved 13 November 2024.
- ^ "Normals". opendata.aemet.es (in Spanish). AEMET OpenData. Archived from the original on 2024-11-26. Retrieved 26 November 2024.
- ^ "AEMET OpenData". AEMET. Retrieved 2024-05-14.


