
File:Adel Melb Temps Heatwave 09.png
No higher resolution available.
Adel_Melb_Temps_Heatwave_09.png (552 × 437 pixels, file size: 13 KB, MIME type: image/png)
Summary
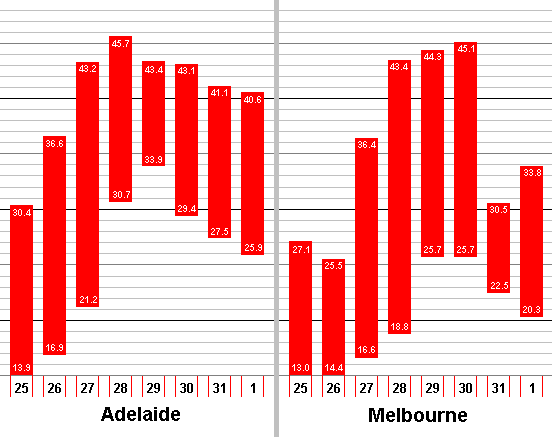
| Description | English: A graph of the temperature in capital cities Adelaide, South Australia and Melbourne, Victoria during the 2009 Southeastern Australia heat wave. Created by myself using information obtained from the Australian Bureau of Meteorology. |
| Date | 1 February 2009 (original upload date) |
| Source |
Own work Transferred from en.wikipedia |
| Author | Nick carson at en.wikipedia |
Licensing
| |
This work has been released into the public domain by its author, Nick carson, at the English Wikipedia project. This applies worldwide. In case this is not legally possible: |
Original upload log
The original description page was here. All following user names refer to en.wikipedia.
- 2009-02-01 11:28 Nick carson 552×437 (13137 bytes) A graph of the temperature in capital cities [[Adelaide, South Australia]] and [[Melbourne, Victoria]] during the [[2009 Southeastern Australia heat wave]]. Created by myself using information obtained from the Australian Bureau of Meteorology.
File history
Click on a date/time to view the file as it appeared at that time.
| Date/Time | Thumbnail | Dimensions | User | Comment | |
|---|---|---|---|---|---|
| current | 18:57, 7 January 2012 | | 552 × 437 (13 KB) | BotMultichillT | {{BotMoveToCommons|en.wikipedia|year={{subst:CURRENTYEAR}}|month={{subst:CURRENTMONTHNAME}}|day={{subst:CURRENTDAY}}}} == {{int:filedesc}} == {{Information |description={{en|1=A graph of the temperature in capital cities [[:en:Adelaide, South Australia|A |
File usage
The following page uses this file: