1990 Costa Rican general election
Presidential election
Turnout 81.81% (pp )
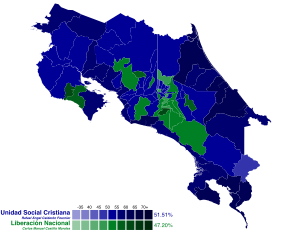
Results by canton
Parliamentary election
Legislative Assembly
This lists parties that won seats. See the complete results below.
Results by province
General elections were held in Costa Rica on 4 February 1990.[ 1] Rafael Ángel Calderón Fournier of the Social Christian Unity Party (PUSC) won the presidential election, whilst his party also won the parliamentary election. Voter turnout was 81.8%.[ 2]
Unlike previous elections, Calderon's nomination was not undisputed. Despite expressing that he would not run again for President after the results of the previous race, he was eventually convinced by his followers. Yet, young former minister and business man Miguel Ángel Rodríguez Echeverría from the liberal faction inside PUSC choose to face Calderón at the primaries.[ 3] [ 4]
Despite the fact that Rodríguez clearly had no chance against Calderón, his candidacy was considered a smart move, as he would start to be in the spotlight and helping his way in future nominations.[ 5] Rolando Araya Monge (nephew of ex-president Luis Alberto Monge ) in PLN 's primaries after a very hostile and traumatic campaign, in which Castillo even accused Araya of links with Narcotraffic , something that weakened PLN.[ 6] United People having some relevance with sociologist Victor Daniel Camacho as nominee earning 3% of the votes.
Results
President Candidate Party Votes % Rafael Ángel Calderón Fournier Social Christian Unity Party 694,589 51.49 Carlos Manuel Castillo Morales [es ] National Liberation Party 636,701 47.20 Víctor Daniel Camacho Monge [es ] United People 9,217 0.68 Fernando Ramírez Muñoz Christian National Alliance Party [es ] 4,209 0.31 Isaac Felipe Azofeifa Party of Progress 2,547 0.19 Edwin Badilla Agüero Militant Workers Revolutionary Party 1,005 0.07 Rodrigo Alberto Cordero Independent Party [es ] 746 0.06 Total 1,349,014 100.00 Valid votes 1,349,014 97.45 Invalid votes 29,919 2.16 Blank votes 5,393 0.39 Total votes 1,384,326 100.00 Registered voters/turnout 1,692,050 81.81 Source: Election Resources
By province
Province
Calderón %
Castillo %
Camacho %
Ramírez %
Azofeifa %
Badilla %
Cordero %
San José
49.39
49.25
0.75
0.28
0.22
0.06
0.05
Alajuela
51.41
47.59
0.43
0.32
0.15
0.06
0.05
Cartago
50.37
48.57
0.53
0.20
0.19
0.08
0.06
Heredia
50.76
47.79
0.73
0.36
0.25
0.05
0.05
Guanacaste 52.72
46.39
0.44
0.24
0.09
0.07
0.05
Puntarenas
56.21
42.24
0.82
0.40
0.15
0.11
0.07
Limón
60.82
37.07
1.06
0.58
0.16
0.21
0.11
Total
51.51
47.20
0.66
0.31
0.19
0.07
0.06
Parliament Party Votes % Seats +/– Social Christian Unity Party 617,478 46.21 29 +4 National Liberation Party 559,632 41.88 25 –4 United People 44,161 3.31 1 0 General Union Party [es ] 32,307 2.42 1 +1 Christian National Alliance Party [es ] 22,149 1.66 0 0 Cartago Agrarian Union Party 14,190 1.06 1 0 National Independent Party 10,635 0.80 0 New Party of Progress 7,733 0.58 0 New Alajuelense Solidarity Party 7,330 0.55 0 0 Independent Party [es ] 5,564 0.42 0 0 Authentic Limonense Party 4,901 0.37 0 0 Agrarian Labour Action Party 4,756 0.36 0 New National Agrarian Party [es ] 4,594 0.34 0 New Militant Workers Revolutionary Party 742 0.06 0 New Total 1,336,172 100.00 57 0 Valid votes 1,336,172 96.55 Invalid votes 32,723 2.36 Blank votes 15,061 1.09 Total votes 1,383,956 100.00 Registered voters/turnout 1,692,050 81.79 Source: Election Resources
By province
Province
PUSC
PLN
PU
PUGEN
ANC
PNI
PdP
Others
%
S
%
S
%
S
%
S
%
S
%
S
%
S
%
S
San José
44.41
10
43.08
9
4.50
1
3.77
1
1.86
0
0.91
0
0.70
0
0.84
0
Alajuela
46.90
5
43.47
5
1.43
0
0.55
0
1.41
0
0.46
0
0.39
0
5.39
0
Cartago
43.22
3
40.71
2
2.71
0
1.58
0
0.95
0
0.85
0
0.54
0
9.44
1
Heredia
46.87
3
42.91
2
4.38
0
1.84
0
1.75
0
0.80
0
1.16
0
0.29
0
Guanacaste
50.52
3
46.12
2
1.00
0
0.57
0
0.97
0
0.61
0
0.10
0
0.11
0
Puntarenas
49.87
3
38.30
3
2.96
0
4.60
0
2.30
0
1.24
0
0.33
0
0.39
0
Limón
50.14
2
29.44
2
4.11
0
0.62
0
2.18
0
0.51
0
0.53
0
12.47
0
Total
46.21
29
41.88
25
3.31
1
2.42
1
1.66
0
0.80
0
0.58
0
3.14
1
Local governments Party Votes % Seats Alderpeople +/– Municipal +/– Social Christian Unity Party 623,021 46.70 274 +42 265 +151 National Liberation Party 569,974 42.72 232 –28 161 –145 United People 44,765 3.36 6 +3 0 0 General Union Party [es ] 28,243 2.12 4 +2 0 0 Christian National Alliance Party [es ] 17,411 1.30 2 +2 0 0 National Independent Party 12,836 0.96 0 0 0 0 Party of Progress 7,815 0.59 0 New 0 New Agrarian Labour Action Party 5,444 0.41 3 New 0 New Alajuelense Solidarity Party 5,298 0.40 0 –1 0 0 National Agrarian Party [es ] 5,017 0.38 2 New 0 New Independent Party [es ] 4,492 0.34 1 +1 0 0 Authentic Limonense Party 3,744 0.28 1 0 0 0 National Union Party 2,221 0.17 0 New 0 New New Alajuelita Party 2,012 0.15 1 0 0 0 Humanist Party 1,929 0.14 0 New 0 New Total 1,334,222 100.00 526 +22 426 +6 Valid votes 1,334,222 96.42 Invalid/blank votes 49,520 3.58 Total votes 1,383,742 100.00 Registered voters/turnout 1,691,689 81.80 Source: TSE[ 7]
References


