
Datei:Northern Hemisphere Sea Ice Extent Anomalies-Mar.png
Größe dieser Vorschau: 800 × 404 Pixel. Weitere Auflösungen: 320 × 162 Pixel | 640 × 323 Pixel | 1.024 × 517 Pixel | 1.727 × 872 Pixel
Originaldatei (1.727 × 872 Pixel, Dateigröße: 199 KB, MIME-Typ: image/png)
![]()
Diese Datei und die Informationen unter dem roten Trennstrich werden aus dem zentralen Medienarchiv Wikimedia Commons eingebunden.
![]()
Beschreibung
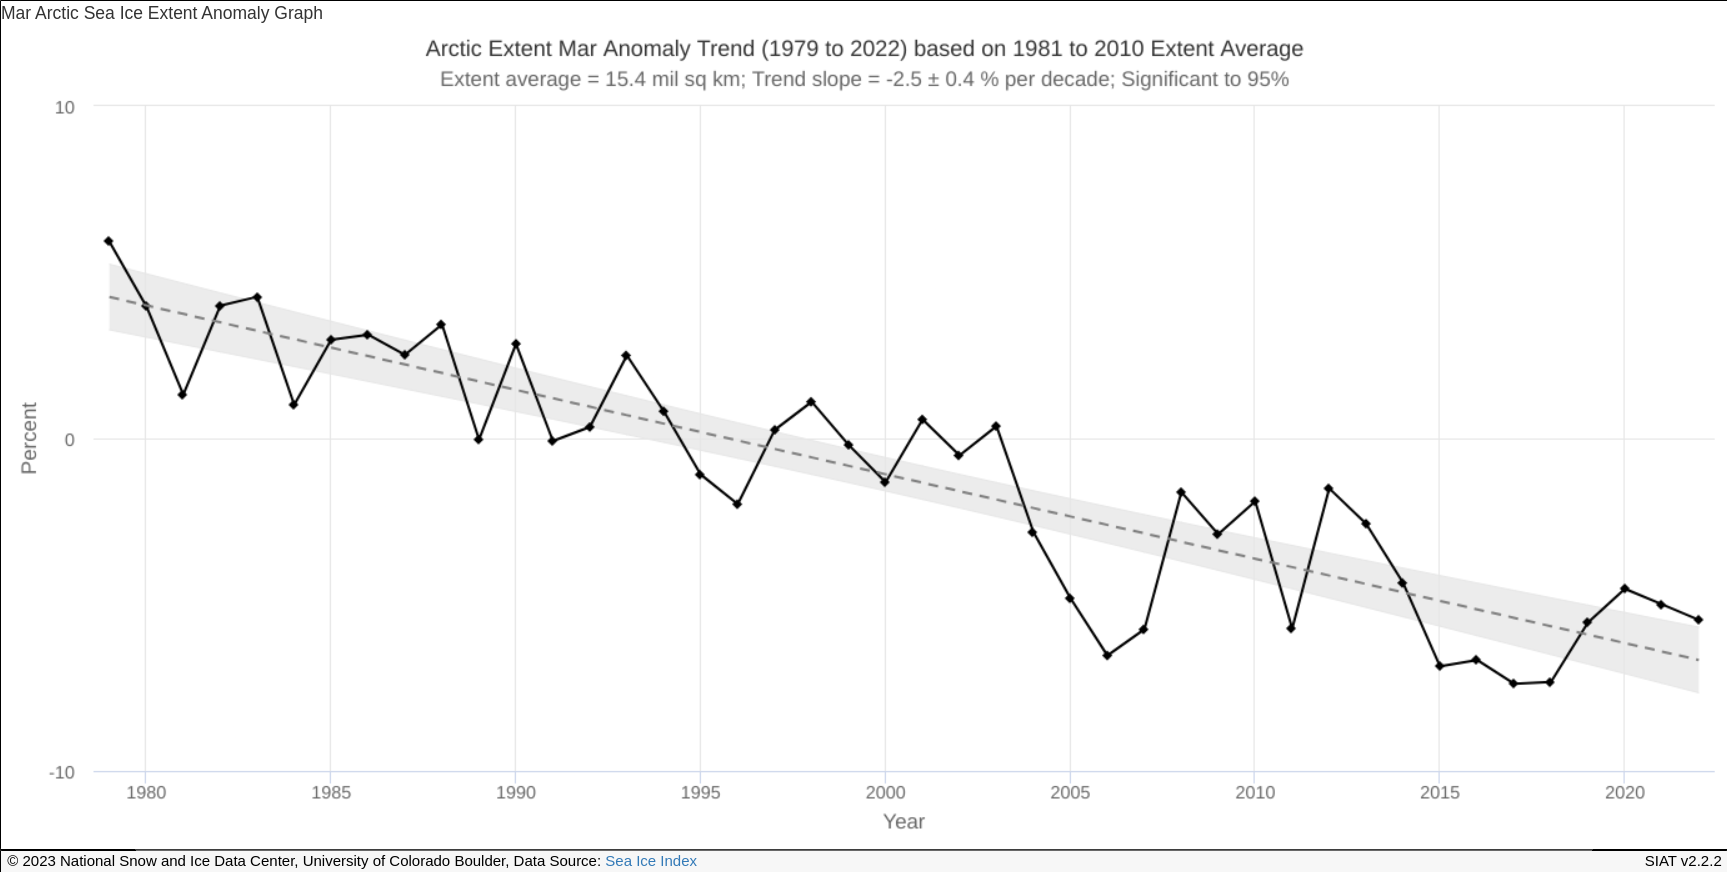
| Beschreibung | English: Trends in Extent Northern Hemisphere (Arctic) Sea Ice: Ice extent anomalies are plotted as a time series of percent differences between the total extent for the month in question, and the mean for that month, where the mean is based on the January 1981 - December 2010 portion of the data set. The trend, in percent change per decade, is obtained using least squares regression, and a 95% confidence interval for the resulting slope is given. |
| Quelle |
Original version: http://nsidc.org/data/seaice_index/archives/index.html |
| Urheber | NSIDC |
Lizenz
Dieses Werk ist in den Vereinigten Staaten gemeinfrei, da es von Mitarbeitern der US-amerikanischen Bundesregierung oder einem ihrer Organe in Ausübung ihrer dienstlichen Pflichten erstellt wurde und deshalb nach Titel 17, Kapitel 1, Sektion 105 des US Code ein Werk der Regierung der Vereinigten Staaten von Amerika ist.
Achtung: Dies bezieht sich nur auf originale Werke der Bundesregierung oder eines ihrer Organe, jedoch nicht auf Werke der Regierung eines Bundesstaates oder einer lokalen Behörde. Ebenfalls ausgeschlossen sind seit 1978 herausgegebene Briefmarken und bestimmte Geldmünzen. |
 | |
| Es wurde festgestellt, dass diese Datei frei von bekannten Beschränkungen durch das Urheberrecht ist, alle verbundenen und verwandten Rechte eingeschlossen. | ||
Dateiversionen
Klicke auf einen Zeitpunkt, um diese Version zu laden.
| Version vom | Vorschaubild | Maße | Benutzer | Kommentar | |
|---|---|---|---|---|---|
| aktuell | 10:37, 2. Jun. 2023 | | 1.727 × 872 (199 KB) | DeWikiMan | update 2022 |
| 17:17, 15. Jan. 2021 |  | 1.260 × 720 (74 KB) | DeWikiMan | update 2020 | |
| 22:07, 15. Jun. 2018 |  | 1.260 × 720 (56 KB) | DeWikiMan | including 2012 through 2017 | |
| 20:06, 30. Dez. 2012 |  | 420 × 240 (57 KB) | DeWikiMan | Including March 2012 | |
| 14:07, 8. Feb. 2012 |  | 420 × 240 (57 KB) | Nils Simon | Including March 2011 | |
| 11:49, 15. Apr. 2010 |  | 1.260 × 720 (217 KB) | Nils Simon | updated, now includes March 2010 | |
| 09:48, 29. Apr. 2009 |  | 1.260 × 720 (215 KB) | Nils Simon | {{Information |Description={{en|1=Trends in Extent Northern Hemisphere (Arctic) Sea Ice: Ice extent anomalies are plotted as a time series of percent differences between the total extent for the month in question, and the mean for that month, where the me |
Dateiverwendung
Die folgenden 2 Seiten verwenden diese Datei: