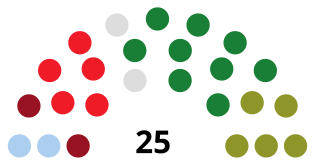
This is the results breakdown of the local elections held in Galicia on 3 April 1979. The following tables show detailed results in the autonomous community's most populous municipalities, sorted alphabetically.[ 1] [ 2]
Overall
Councillor share for parties securing >1.0% of councillors up for election.
Other (18.86%)
Summary of the 3 April 1979 municipal election results in Galicia →
Parties and alliances
Popular vote
Councillors
Votes
%
±pp
Total
+/−
Union of the Democratic Centre (UCD)
389,593
36.44
n/a 1,797
n/a
Spanish Socialist Workers' Party (PSOE)
154,166
14.42
n/a
437
n/a
Democratic Coalition (CD)
147,290
13.78
n/a
603
n/a
Galician National-Popular Bloc (BNPG)
78,216
7.32
n/a
258
n/a
Galician Unity (PG –POG –PSG )
69,060
6.46
n/a
141
n/a
Communist Party of Galicia (PCG)
48,482
4.53
n/a
70
n/a
Party of Labour of Galicia (PTG)
7,865
0.74
n/a
14
n/a
Spanish Socialist Workers' Party (historical) (PSOEh)
6,049
0.57
n/a
29
n/a
Independents (Lugo) (INDEP)
4,362
0.41
n/a
4
n/a
Independent Candidacy for Lugo (CIL)
4,013
0.38
n/a
3
n/a
Communist Movement of Galicia (MCG)
3,883
0.36
n/a
5
n/a
Independent Candidacy (CI)
3,213
0.30
n/a
4
n/a
Independents (Orense) (INDEP)
2,237
0.21
n/a
2
n/a
Democratic Candidacy (CDE)
2,090
0.20
n/a
8
n/a
Electors' Group (Electores)
1,926
0.18
n/a
0
n/a
Progressive Electors' Group of Riveira (AEPR)
1,294
0.12
n/a
3
n/a
Independent Progressive Candidacy (CPI)
1,287
0.12
n/a
4
n/a
Independents (La Estrada/1) (INDEP)
1,259
0.12
n/a
2
n/a
Independents (La Estrada/2) (INDEP)
1,176
0.11
n/a
2
n/a
Spanish National Union (UNE)
931
0.09
n/a
0
n/a
Revolutionary Communist League (LCR)
796
0.07
n/a
0
n/a
Spanish Phalanx of the CNSO (FE–JONS)
756
0.07
n/a
0
n/a
Others
139,146
13.02
n/a
686
n/a
Blank ballots
0
0.00
n/a
Total
1,069,090
100.00
4,072
n/a
Valid votes
1,069,090
98.50
n/a
Invalid votes
16,327
1.50
n/a
Votes cast / turnout
1,085,417
51.47
n/a
Abstentions
1,023,558
48.53
n/a
Registered voters
2,108,975
Sources[ 1] [ 3]
City control The following table lists party control in the most populous municipalities, including provincial capitals (shown in bold ).[ 1]
Municipalities
El Ferrol del Caudillo Population: 88,161
Summary of the 3 April 1979 City Council of El Ferrol del Caudillo election results →
Parties and alliances
Popular vote
Seats
Votes
%
±pp
Total
+/−
Spanish Socialist Workers' Party (PSOE)
9,705
27.26
n/a 8 n/a
Union of the Democratic Centre (UCD)
8,843
24.84
n/a
7 n/a
Communist Party of Galicia (PCG)
6,752
18.97
n/a
5 n/a
Galician Unity (PG –POG –PSG )
4,802
13.49
n/a
3 n/a
Democratic Coalition (CD)
3,449
9.69
n/a
2 n/a
Galician National-Popular Bloc (BNPG)
1,500
4.21
n/a
0
n/a
Party of Labour of Galicia (PTG)
371
1.04
n/a
0
n/a
Communist Movement of Galicia (MCG)
174
0.49
n/a
0
n/a
Blank ballots
0
0.00
n/a
Total
35,596
25
n/a
Valid votes
35,596
99.06
n/a
Invalid votes
338
0.94
n/a
Votes cast / turnout
35,934
55.39
n/a
Abstentions
28,940
44.61
n/a
Registered voters
64,874
Sources[ 1] [ 4]
Population: 224,289
Summary of the 3 April 1979 City Council of La Coruña election results →
Parties and alliances
Popular vote
Seats
Votes
%
±pp
Total
+/−
Union of the Democratic Centre (UCD)
24,480
28.05
n/a 8 n/a
Spanish Socialist Workers' Party (PSOE)
17,903
20.51
n/a
6 n/a
Galician Unity (PG –POG –PSG )
15,060
17.26
n/a
5 n/a
Democratic Coalition (CD)
11,428
13.09
n/a
4 n/a
Communist Party of Galicia (PCG)
7,639
8.75
n/a
2 n/a
Galician National-Popular Bloc (BNPG)
7,268
8.33
n/a
2 n/a
Party of Labour of Galicia (PTG)
1,576
1.81
n/a
0
n/a
Communist Movement of Galicia (MCG)
894
1.02
n/a
0
n/a
Spanish Phalanx of the CNSO (FE–JONS)
756
0.87
n/a
0
n/a
Revolutionary Communist League (LCR)
269
0.31
n/a
0
n/a
Blank ballots
0
0.00
n/a
Total
87,273
27
n/a
Valid votes
87,273
98.14
n/a
Invalid votes
1,654
1.86
n/a
Votes cast / turnout
88,927
53.54
n/a
Abstentions
77,179
46.46
n/a
Registered voters
166,106
Sources[ 1] [ 5]
Lugo Population: 71,574
Summary of the 3 April 1979 City Council of Lugo election results →
Parties and alliances
Popular vote
Seats
Votes
%
±pp
Total
+/−
Union of the Democratic Centre (UCD)
8,179
27.20
n/a 8 n/a
Democratic Coalition (CD)
4,505
14.98
n/a
4 n/a
Independents (INDEP)
4,362
14.50
n/a
4 n/a
Spanish Socialist Workers' Party (PSOE)
4,081
13.57
n/a
4 n/a
Independent Candidacy for Lugo (CIL)
4,013
13.34
n/a
3 n/a
Galician National-Popular Bloc (BNPG)
2,168
7.21
n/a
2 n/a
Communist Party of Galicia (PCG)
1,478
4.91
n/a
0
n/a
Spanish National Union (UNE)
931
3.10
n/a
0
n/a
Party of Labour of Galicia (PTG)
304
1.01
n/a
0
n/a
Communist Movement of Galicia (MCG)
54
0.18
n/a
0
n/a
Blank ballots
0
0.00
n/a
Total
30,075
25
n/a
Valid votes
30,075
100.00
n/a
Invalid votes
0
0.00
n/a
Votes cast / turnout
30,075
56.79
n/a
Abstentions
22,882
43.21
n/a
Registered voters
52,957
Sources[ 1] [ 6]
Orense Population: 88,029
Summary of the 3 April 1979 City Council of Orense election results →
Parties and alliances
Popular vote
Seats
Votes
%
±pp
Total
+/−
Union of the Democratic Centre (UCD)
10,514
32.22
n/a 9 n/a
Democratic Coalition (CD)
6,638
20.34
n/a
5 n/a
Spanish Socialist Workers' Party (PSOE)
5,867
17.98
n/a
5 n/a
Communist Party of Galicia (PCG)
2,962
9.08
n/a
2 n/a
Galician National-Popular Bloc (BNPG)
2,934
8.99
n/a
2 n/a
Independents (INDEP)
2,237
6.86
n/a
2 n/a
Spanish Socialist Workers' Party (historical) (PSOEh)
1,228
3.76
n/a
0
n/a
Communist Movement of Galicia (MCG)
252
0.77
n/a
0
n/a
Blank ballots
0
0.00
n/a
Total
32,632
25
n/a
Valid votes
32,632
98.78
n/a
Invalid votes
402
1.22
n/a
Votes cast / turnout
33,034
51.12
n/a
Abstentions
31,589
48.88
n/a
Registered voters
64,623
Sources[ 1] [ 7]
Pontevedra Population: 63,863
Summary of the 3 April 1979 City Council of Pontevedra election results →
Parties and alliances
Popular vote
Seats
Votes
%
±pp
Total
+/−
Union of the Democratic Centre (UCD)
7,467
32.00
n/a 9 n/a
Galician Unity (PG –POG –PSG )
5,234
22.43
n/a
6 n/a
Independent Candidacy (CI)
3,213
13.77
n/a
4 n/a
Spanish Socialist Workers' Party (PSOE)
2,756
11.81
n/a
3 n/a
Democratic Coalition (CD)
1,407
6.03
n/a
1 n/a
Galician National-Popular Bloc (BNPG)
1,302
5.58
n/a
1 n/a
Communist Party of Galicia (PCG)
1,266
5.43
n/a
1 n/a
Party of Labour of Galicia (PTG)
557
2.39
n/a
0
n/a
Communist Movement of Galicia (MCG)
133
0.57
n/a
0
n/a
Blank ballots
0
0.00
n/a
Total
23,335
25
n/a
Valid votes
23,335
98.71
n/a
Invalid votes
304
1.29
n/a
Votes cast / turnout
23,639
53.32
n/a
Abstentions
20,695
46.68
n/a
Registered voters
44,334
Sources[ 1] [ 8]
Santiago de Compostela Population: 81,536
Summary of the 3 April 1979 City Council of Santiago de Compostela election results →
Parties and alliances
Popular vote
Seats
Votes
%
±pp
Total
+/−
Union of the Democratic Centre (UCD)
9,663
35.07
n/a 10 n/a
Galician Unity (PG –POG –PSG )
4,871
17.68
n/a
5 n/a
Democratic Coalition (CD)
3,694
13.41
n/a
3 n/a
Spanish Socialist Workers' Party (PSOE)
3,305
12.00
n/a
3 n/a
Galician National-Popular Bloc (BNPG)
2,580
9.36
n/a
2 n/a
Communist Party of Galicia (PCG)
2,559
9.29
n/a
2 n/a
Party of Labour of Galicia (PTG)
622
2.26
n/a
0
n/a
Communist Movement of Galicia (MCG)
257
0.93
n/a
0
n/a
Blank ballots
0
0.00
n/a
Total
27,551
25
n/a
Valid votes
27,551
97.93
n/a
Invalid votes
582
2.07
n/a
Votes cast / turnout
28,133
49.06
n/a
Abstentions
29,215
50.94
n/a
Registered voters
57,348
Sources[ 1] [ 9]
Vigo Population: 254,051
Summary of the 3 April 1979 City Council of Vigo election results →
Parties and alliances
Popular vote
Seats
Votes
%
±pp
Total
+/−
Union of the Democratic Centre (UCD)
26,153
30.19
n/a 9 n/a
Spanish Socialist Workers' Party (PSOE)
22,789
26.30
n/a
8 n/a
Democratic Coalition (CD)
10,217
11.79
n/a
3 n/a
Galician Unity (PG –POG –PSG )
8,942
10.32
n/a
3 n/a
Communist Party of Galicia (PCG)
8,901
10.27
n/a
3 n/a
Galician National-Popular Bloc (BNPG)
5,497
6.34
n/a
1 n/a
Electors' Group (Electores)
1,926
2.22
n/a
0
n/a
Party of Labour of Galicia (PTG)
962
1.11
n/a
0
n/a
Communist Movement of Galicia (MCG)
728
0.84
n/a
0
n/a
Revolutionary Communist League (LCR)
527
0.61
n/a
0
n/a
Blank ballots
0
0.00
n/a
Total
86,642
27
n/a
Valid votes
86,642
98.23
n/a
Invalid votes
1,562
1.77
n/a
Votes cast / turnout
88,204
51.54
n/a
Abstentions
82,917
48.46
n/a
Registered voters
171,121
Sources[ 1] [ 10]
References


