Piper diagram

A Piper diagram is a graphic procedure proposed by Arthur M. Piper in 1944 for presenting water chemistry data to help in understanding the sources of the dissolved constituent salts in water. This procedure is based on the premise that cations and anions in water are in such amounts to assure the electroneutrality of the dissolved salts, in other words the algebraic sum of the electric charges of cations and anions is zero.[1]

A Piper diagram is a graphical representation of the chemistry of a water sample or samples.
The cations and anions are shown by separate ternary plots. The apexes of the cation plot are calcium, magnesium and sodium plus potassium cations. The apexes of the anion plot are sulfate, chloride and carbonate plus hydrogen carbonate anions. The two ternary plots are then projected onto a diamond.[3] The diamond is a matrix transformation of a graph of the anions (sulfate + chloride/ total anions) and cations (sodium + potassium/total cations).[4]
The Piper diagram is suitable for comparing the ionic composition of a set of water samples, but does not lend itself to spatial comparisons. For geographical applications, the Stiff diagram and Maucha diagram are more applicable, because they can be used as markers on a map.[5] Colour coding of the background of the Piper diagram allows linking Piper Diagrams and maps[6]
Water samples shown on the Piper diagram can be grouped in hydrochemical facies.[7] The cation and anion triangles can be separated in regions based on the dominant cation(s) or anion(s) and their combination creates regions in the diamond shaped part of the diagram.

See also
- Ternary diagram, just one triangle
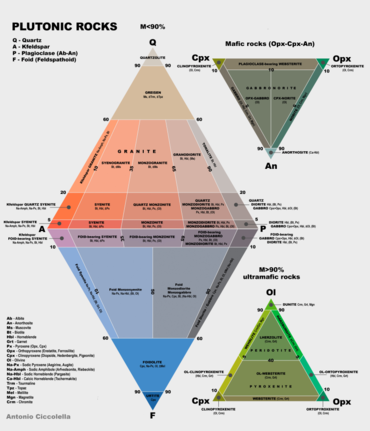
- QAPF diagram, a common application
References
- ^ Piper, Arthur (1944). "A graphic procedure in the geochemical interpretation of water-analyses". Transactions, American Geophysical Union. 25 (6): 914–928. Bibcode:1944TrAGU..25..914P. doi:10.1029/TR025i006p00914.
- ^ Love, D.; Moyce, W.; Ravengai, S. (2006). "Livelihood challenges posed by water quality in the Mzingwane and Thuli river catchments, Zimbabwe" (PDF). 7th WaterNet/WARFSA/GWP-SA Symposium, Lilongwe, Malawi. Archived from the original (PDF) on 2011-07-24. Retrieved 2008-06-20.
- ^ Piper, A.M. (1953). A Graphic Procedure in the Geochemical Interpretation of Water Analysis. Washington D.C.: United States Geological Survey. OCLC 37707555. ASIN B0007HRZ36.
- ^ Rao, N. Srinivasa (December 1998). "MHPT.BAS: a computer program for modified Hill–Piper diagram for classification of ground water". Computers & Geosciences. 24 (10): 991–1008. Bibcode:1998CG.....24..991R. doi:10.1016/S0098-3004(98)00083-1.
- ^ Velasco, V.; Tubau, I.; Vázquez-Suñè, E.; Gogu, R.; Gaitanaru, D.; Alcaraz, M.; Serrano-Juan, A.; Fernàndez-Garcia, D.; Garrido, T.; Fraile, J.; Sanchez-Vila, X.; Sep (2014). "GIS-based hydrogeochemical analysis tools (QUIMET)". Computers & Geosciences. 70: 164–180. Bibcode:2014CG.....70..164V. doi:10.1016/j.cageo.2014.04.013.
- ^ Peeters, Luk (2014-01-01). "A Background Color Scheme for Piper Plots to Spatially Visualize Hydrochemical Patterns". Groundwater. 52 (1): 2–6. doi:10.1111/gwat.12118. ISSN 1745-6584. PMID 24102292. S2CID 205152097.
- ^ Sadashivaiah, C.; Ramakrishnaiah, C.R.; Ranganna, G. (2008). "Hydrochemical Analysis and Evaluation of Groundwater Quality in Tumkur Taluk, Karnataka State, India". International Journal of Environmental Research and Public Health. 5 (3): 158–164. doi:10.3390/ijerph5030158. PMC 3699986. PMID 19139534.
