LDS Church membership in the United States
Recent Membership History Year Members 2012 6,321,416 (2.02% of US total) 2013 6,398,889 (2.03% of US total) 2014 6,466,267 (2.03% of US total) 2015 6,531,656 (2.04% of US total) 2016 6,592,195 (2.04% of US total) 2017 6,641,886 (2.01% of US total) 2018 6,681,829 (2.01% of US total) 2019 6,721,032 (2.02% of US total) *2020 6,742,000 (2.00% of US total) 2021 6,763,019 (2.01% of US total) 2022 6,804,028 (2.01% of US total) 2023 6,868,793 (2.05% of US total) Source: https://newsroom.churchofjesuschrist.org/facts-and-statistics/country/united-states (*2020 is an estimate since official numbers weren't released.)
This page shows the membership statistics of the Church of Jesus Christ of Latter-day Saints (LDS Church) within the United States .
Official LDS Membership - Membership count on record provided by the LDS Church. These records include adults and children, and also include both active and less active members.From religious surveys - General religious surveys conducted within the United States. These surveyed U.S. adults about their religious beliefs.
Membership defined Membership reported by the Church of Jesus Christ of Latter-day Saints on December 31, 2023, was used to determine the number of members in each state.[ 1] [ 4]
"Those who have been baptized and confirmed."
"Those under age nine who have been blessed but not baptized."
"Those who are not accountable because of intellectual disabilities, regardless of age."
"Unblessed children under 8 when both of the following apply:
"At least one parent or one grandparent is a member of the Church."
"Both parents give permission for a record to be created. (If only one parent has legal custody of the child, the permission of that parent is sufficient.)" The United States Census Bureau 2023 population estimates was used as the basis for the general population.[ 5]
LDS membership as percentage of population by US states (2021) LDS membership in absolute numbers, by US states (2021)
Table
Congregational
Members and growth
State
Area
Members
Population
%LDS
2013
Change
Growth (%)
% of Total Growth
Pew ARDA
Alabama
NA Southeast40,540
5,108,468
0.79%
35,708
4,832
13.53%
1.03%
1%
10th
Alaska
NA West33,948
733,406
4.63%
33,033
915
2.77%
0.19%
5%
2nd
Arizona
NA Southwest442,879
7,431,344
5.96%
414,261
28,618
6.91%
6.09%
5%
2nd
Arkansas
NA Southeast36,630
3,067,732
1.19%
28,667
7,963
27.78%
1.69%
1%
9th
California
NA West728,598
38,965,193
1.87%
777,061
−48,463
-6.24%
-10.31%
1%
2nd
Colorado
NA Central149,186
5,877,610
2.54%
147,707
1,479
1%
0.31%
2%
2nd
Connecticut
NA Northeast16,030
3,617,176
0.44%
15,273
757
4.96%
0.16%
1%
10th
Delaware
NA Northeast5,736
1,031,890
0.56%
5,080
656
12.91%
0.14%
<1%
11th
Florida
NA Southeast172,918
22,610,726
0.76%
143,057
29,861
20.87%
6.35%
1%
8th
Georgia
NA Southeast91,142
11,029,227
0.83%
80,548
10,594
13.15%
2.25%
1%
8th
Hawaii
NA West75,635
1,435,138
5.27%
72,459
3,176
4.38%
0.68%
3%
2nd
Idaho
NA Central476,118
1,964,726
24.23%
422,345
53,773
12.73%
11.44%
19%
1st
Illinois
NA Central57,837
12,549,689
0.46%
56,531
1,306
2.31%
0.28%
<1%
13th
Indiana
NA Northeast47,789
6,862,199
0.7%
42,147
5,642
13.39%
1.2%
1%
13th
Iowa
NA Central29,285
3,207,004
0.91%
26,001
3,284
12.63%
0.7%
<1%
13th
Kansas
NA Central39,793
2,940,546
1.35%
35,627
4,166
11.69%
0.89%
1%
10th
Kentucky
NA Southeast38,535
4,526,154
0.85%
33,455
5,080
15.18%
1.08%
<1%
8th
Louisiana
NA Southeast29,913
4,573,749
0.65%
29,366
547
1.86%
0.12%
<1%
6th
Maine
NA Northeast11,233
1,395,722
0.8%
10,778
455
4.22%
0.1%
2%
6th
Maryland
NA Northeast44,094
6,180,253
0.71%
43,227
867
2.01%
0.18%
1%
8th
Massachusetts
NA Northeast28,667
7,001,399
0.41%
25,996
2,671
10.27%
0.57%
1%
11th
Michigan
NA Northeast46,044
10,037,261
0.46%
43,178
2,866
6.64%
0.61%
<1%
13th
Minnesota
NA Central33,759
5,737,915
0.59%
31,298
2,461
7.86%
0.52%
1%
12th
Mississippi
NA Southeast22,297
2,939,690
0.76%
21,704
593
2.73%
0.13%
1%
10th
Missouri
NA Central80,440
6,196,156
1.3%
67,943
12,497
18.39%
2.66%
1%
8th
Montana
NA Central52,068
1,132,812
4.6%
47,854
4,214
8.81%
0.9%
4%
2nd
Nebraska
NA Central25,935
1,978,379
1.31%
23,688
2,247
9.49%
0.48%
1%
6th
Nevada
NA Southwest182,786
3,194,176
5.72%
178,737
4,049
2.27%
0.86%
4%
2nd
New Hampshire
NA Northeast8,553
1,402,054
0.61%
8,335
218
2.62%
0.05%
1%
6th
New Jersey
NA Northeast35,453
9,290,841
0.38%
32,744
2,709
8.27%
0.58%
<1%
15th
New Mexico
NA Southwest69,432
2,114,371
3.28%
69,365
67
0.1%
0.01%
1%
3rd
New York
NA Northeast87,605
19,571,216
0.45%
79,933
7,672
9.6%
1.63%
<1%
13th
North Carolina
NA Southeast95,875
10,835,491
0.88%
79,835
16,040
20.09%
3.41%
1%
8th
North Dakota
NA Central11,682
783,926
1.49%
9,122
2,560
28.06%
0.54%
<1%
7th
Ohio
NA Northeast64,595
11,785,935
0.55%
59,662
4,933
8.27%
1.05%
1%
14th
Oklahoma
NA Southwest52,844
4,053,824
1.3%
45,008
7,836
17.41%
1.67%
1%
8th
Oregon
NA West150,170
4,233,358
3.55%
150,630
−460
-0.31%
-0.1%
3%
2nd
Pennsylvania
NA Northeast53,025
12,961,683
0.41%
51,171
1,854
3.62%
0.39%
<1%
13th
Rhode Island
NA Northeast4,796
1,095,962
0.44%
4,054
742
18.3%
0.16%
<1%
8th
South Carolina
NA Southeast45,810
5,373,555
0.85%
38,676
7,134
18.45%
1.52%
<1%
11th
South Dakota
NA Central11,601
919,318
1.26%
10,385
1,216
11.71%
0.26%
<1%
8th
Tennessee
NA Southeast59,202
7,126,489
0.83%
47,343
11,859
25.05%
2.52%
1%
10th
Texas
NA Southwest385,600
30,503,301
1.26%
315,895
69,705
22.07%
14.83%
1%
6th
Utah
Utah
2,190,610
3,417,734
64.1%
1,951,937
238,673
12.23%
50.79%
55%
1st
Vermont
NA Northeast4,624
647,464
0.71%
4,596
28
0.61%
0.01%
<1%
7th
Virginia
NA Northeast98,786
8,715,698
1.13%
92,407
6,379
6.9%
1.36%
2%
7th
Washington
NA West281,802
7,812,880
3.61%
276,837
4,965
1.79%
1.06%
3%
2nd
Washington, D.C.
NA Northeast3,215
678,972
0.47%
2,485
730
29.38%
0.16%
1%
39th
West Virginia
NA Northeast17,557
1,770,071
0.99%
17,060
497
2.91%
0.11%
2%
9th
Wisconsin
NA Central28,430
5,910,955
0.48%
25,686
2,744
10.68%
0.58%
<1%
10th
Wyoming
NA Central67,691
584,057
11.59%
65,485
2,206
3.37%
0.47%
9%
1st
Territories
Country
Area
Members
Population
%LDS
2013
Change
Growth (%)
% of Total Growth
American Samoa
Pacific
16,611
43,895
37.843%
16,621
−10
-0.06%
-0%
Guam
Asia North
2,511
169,532
1.481%
2,265
246
10.861%
0.011%
Northern Mariana Islands
Pacific
896
51,118
1.753%
789
107
13.561%
0.005%
Puerto Rico
Caribbean
23,222
3,019,450
0.769%
23,064
158
0.685%
0.007%
United States Virgin Islands
Caribbean
638
104,377
0.611%
590
48
8.136%
0.002%
Totals
43,878
3,388,372
1.23%
43,329
549
1.27%
0.02%
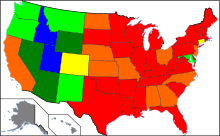
From religious surveys Percentage of US adult population by state claiming membership in the LDS church in the 2001 ARIS survey. Click image for map legend. The 2001 American Religious Identification Survey (ARIS) was based on a random digit-dialed telephone survey of 50,281 American adults in the continental U.S.
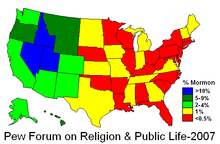
Percentage of US adult population, by state, claiming Mormon as religious preference in the 2007 survey by the Pew Forum on Religion & Public Life. The Pew Forum on Religion & Public Life published a survey of 35,556 adults living in the United States that was conducted in 2007.[ 6] [ 7] [ 8] [ 9]
Demographic
Mormons (U.S.)
U.S. Avg.
Married
71 %
54 %
Divorced or separated
9 %
12 %
3 or more children at home
21 %
9 %
Weekly (or more) Attendance at Religious Services
76 %
39 %
Race, Ethnicity
Mormons (U.S.)
U.S. Avg.
White, non-Hisp.
86 %
71 %
Black, non-Hisp.
3 %
11 %
Other non-Hisp.
5 %
6 %
Hispanic
7 %
12 %
See also
References
^ a b "Facts and Statistics: Statistics by Country: United States" , Newsroom , LDS Church, retrieved 2 November 2024 ^ Excludes groups meeting separate from wards and branches
^ Find a FamilySearch Location , retrieved 2 November 2024 ^ "General Handbook [2022], 33.6.2 Members of Record" . ChurchofJesusChrist.org . Retrieved 11 Aug 2022 .^ "State Population Totals: 2020-2023" . www.census.gov . Retrieved 2024-11-02 .^ "Religion in American Culture -- Pew Forum on Religion & Public Life" . Archived from the original on 14 February 2015. Retrieved 14 February 2015 .^ Portrait of Mormons in the U.S. Archived 2009-07-30 at the Wayback Machine , Pew Forum on Religion & Public Life , July 24, 2009^ "The most and least racially diverse U.S. religious groups" . pewresearch.org . Jul 27, 2015.^ "Racial and ethnic composition among Mormons" . pewforum.org . Retrieved 2021-11-24 .
North America South America Europe Africa Asia Oceania


