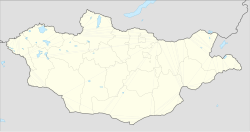
Khutag-Öndör
Khutag-Öndör District Хутаг-Өндөр сум ᠬᠤᠲᠤᠭᠥᠨᠳᠦᠷᠰᠤᠮᠤ | |
|---|---|
| Coordinates: 49°23′33″N 102°42′9″E / 49.39250°N 102.70250°E | |
| Country | Mongolia |
| Province | Bulgan Province |
| Time zone | UTC+8 (UTC + 8) |
Khutag-Öndör (Mongolian: Хутаг-Өндөр) is a sum (district) of Bulgan Province in northern Mongolia. In 2009, its population was 4,591.[1]
Climate
Khutag-Öndör has a humid continental climate (Köppen climate classification Dwb) with warm summers and severely cold winters. Most precipitation falls in the summer as rain, with some snow in the adjacent months of May and September. Winters are very dry.
| Climate data for Khutag-Öndör | |||||||||||||
|---|---|---|---|---|---|---|---|---|---|---|---|---|---|
| Month | Jan | Feb | Mar | Apr | May | Jun | Jul | Aug | Sep | Oct | Nov | Dec | Year |
| Record high °C (°F) | 7.4 (45.3) |
9.8 (49.6) |
19.5 (67.1) |
30.0 (86.0) |
35.2 (95.4) |
36.9 (98.4) |
40.5 (104.9) |
35.5 (95.9) |
29.5 (85.1) |
26.4 (79.5) |
13.9 (57.0) |
13.3 (55.9) |
40.5 (104.9) |
| Mean daily maximum °C (°F) | −15.6 (3.9) |
−9.7 (14.5) |
2.3 (36.1) |
12.0 (53.6) |
20.2 (68.4) |
24.5 (76.1) |
24.7 (76.5) |
23.1 (73.6) |
17.8 (64.0) |
9.1 (48.4) |
−3.4 (25.9) |
−13.2 (8.2) |
7.6 (45.8) |
| Daily mean °C (°F) | −23.8 (−10.8) |
−19.4 (−2.9) |
−7.1 (19.2) |
3.0 (37.4) |
11.2 (52.2) |
16.1 (61.0) |
17.4 (63.3) |
15.4 (59.7) |
8.8 (47.8) |
-0.0 (32.0) |
−11.2 (11.8) |
−20.4 (−4.7) |
−0.8 (30.5) |
| Mean daily minimum °C (°F) | −29.8 (−21.6) |
−27.0 (−16.6) |
−15.0 (5.0) |
−5.0 (23.0) |
2.5 (36.5) |
8.5 (47.3) |
11.4 (52.5) |
9.2 (48.6) |
2.2 (36.0) |
−6.7 (19.9) |
−17.6 (0.3) |
−26.4 (−15.5) |
−7.8 (18.0) |
| Record low °C (°F) | −46.2 (−51.2) |
−44.3 (−47.7) |
−35.5 (−31.9) |
−22.1 (−7.8) |
−11.5 (11.3) |
−3.8 (25.2) |
0.4 (32.7) |
−2.1 (28.2) |
−9.6 (14.7) |
−22.3 (−8.1) |
−36.4 (−33.5) |
−41.5 (−42.7) |
−46.2 (−51.2) |
| Average precipitation mm (inches) | 1.9 (0.07) |
2.2 (0.09) |
3.0 (0.12) |
8.6 (0.34) |
22.5 (0.89) |
53.0 (2.09) |
103.3 (4.07) |
88.2 (3.47) |
35.4 (1.39) |
12.0 (0.47) |
3.8 (0.15) |
2.6 (0.10) |
336.5 (13.25) |
| Average precipitation days (≥ 1.0 mm) | 0.7 | 0.5 | 0.9 | 2.3 | 3.5 | 7.8 | 10.9 | 10.2 | 5.2 | 2.7 | 1.2 | 0.9 | 46.8 |
| Mean monthly sunshine hours | 183.2 | 203.7 | 255.3 | 249.9 | 291.2 | 283.7 | 263.0 | 261.7 | 245.8 | 222.0 | 173.2 | 157.4 | 2,790.1 |
| Source: NOAA (1973-1990) [2] | |||||||||||||
References
- ^ Bulgan Aimag Statistical Office: Annual Report 2009 Archived July 22, 2011, at the Wayback Machine
- ^ "Khutag Climate Normals 1973-1990". National Oceanic and Atmospheric Administration. Retrieved January 13, 2013.
External links
 Hutag-Ondor travel guide from Wikivoyage

