Summary
Licensing I, the copyright holder of this work, hereby publish it under the following license:
You are free:
to share – to copy, distribute and transmit the workto remix – to adapt the work
Under the following conditions:
attribution – You must give appropriate credit, provide a link to the license, and indicate if changes were made. You may do so in any reasonable manner, but not in any way that suggests the licensor endorses you or your use.share alike – If you remix, transform, or build upon the material, you must distribute your contributions under the same or compatible license as the original. https://creativecommons.org/licenses/by-sa/4.0 CC BY-SA 4.0 Creative Commons Attribution-Share Alike 4.0 true true
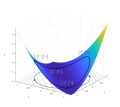
Source code The graph was made in Matlab with the following source code.
% Function data
[X,Y] = meshgrid(-1.2:0.1:1.2, -1.2:0.1:1.2);
Z = (X+Y).^2;

% Constraint data
t = -pi:0.01:pi;
xc = cos(t);
yc = sin(t);
zc = (xc+yc).^2;

% Plot graph and 'constraint'
figure();
surfc(X,Y,Z);
hold on;
plot3(xc, yc, zc, 'k', 'LineWidth', 2);
plot3(xc, yc, 0*ones(1,length(t)), 'k', 'LineWidth', 1);

set(1, 'Color', [1 1 1]);
set(1, 'Position', [46 107 767 682]);
% Axis labels
text(0.0, -2.2, 0, 'x');
text(2.0, -.3, 0, 'y');
text(-1.5, -1.5, 3, 'z');

% Annotations of the max and min points
% Points indicating max
plot3(sqrt(2)/2, sqrt(2)/2, 2, 'kx', 'MarkerSize', 10, 'LineWidth', 1);
plot3(sqrt(2)/2, sqrt(2)/2, 0, 'kx', 'MarkerSize', 10, 'LineWidth', 1);
text('Interpreter', 'latex', 'String', '$$\left(\frac{\sqrt{2}}{2}, \frac{\sqrt{2}}{2}, 2\right)$$',...
        'Position', [+.3 .6 2.4], 'FontSize', 9);

plot3(-sqrt(2)/2, -sqrt(2)/2, 2, 'kx', 'MarkerSize', 10, 'LineWidth', 1);
plot3(-sqrt(2)/2, -sqrt(2)/2, 0, 'kx', 'MarkerSize', 10, 'LineWidth', 1);
text('Interpreter', 'latex', 'String', '$$\left(\frac{-\sqrt{2}}{2}, \frac{-\sqrt{2}}{2}, 2\right)$$',...
        'Position', [-0.9 -0.5 +2.2], 'FontSize', 9);

% Points indicating min
plot3(-sqrt(2)/2, sqrt(2)/2, 0, 'kx', 'MarkerSize', 10, 'LineWidth', 1);
text('Interpreter', 'latex', 'String', '$$\left(\frac{\sqrt{2}}{2}, \frac{-\sqrt{2}}{2}, 2\right)$$',...
        'Position', [+0.8 -1.3 +1.1], 'FontSize', 9, 'Color', 'white');

plot3(sqrt(2)/2, -sqrt(2)/2, 0, 'kx', 'MarkerSize', 10, 'LineWidth', 1);
text('Interpreter', 'latex', 'String', '$$\left(\frac{-\sqrt{2}}{2}, \frac{\sqrt{2}}{2}, 2\right)$$',...
        'Position', [-0.2 -0.5 +1.0], 'FontSize', 9, 'Color', 'white');

hold off

view([34 24]);

%interpolate for improved rendering
shading interp;
English Add a one-line explanation of what this file represents


