Demographics of Bradford
| Demographics of Bradford | |
|---|---|
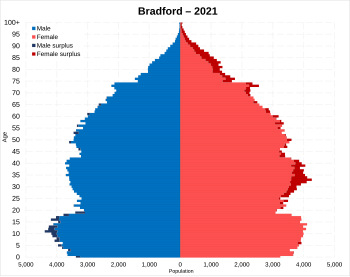 Population pyramid of Bradford | |
| Population | 522,452 (2011) |

Bradford, England is an ethnically and culturally diverse city. The City of Bradford metropolitan borough is the sixth most populous local authority district in the United Kingdom, and includes not only Bradford but also the towns and villages of Keighley, Shipley, Bingley, Ilkley, Haworth, Silsden, Queensbury, Thornton and Denholme.
Built-up area
The Office for National Statistics identifies "Bradford Built-up area subdivision", defined by its own algorithm,[1] as an area of 81.74 km2 (31.56 sq mi) with a 2011 population of 349,561 and a density of 4,280 people per square km.[2] It is a subdivision of the West Yorkshire Built-up Area.
Population
The City of Bradford's total population, according to the 2011 UK census, was 522,452. The population density was 1,428 people per square km.
Ethnicity
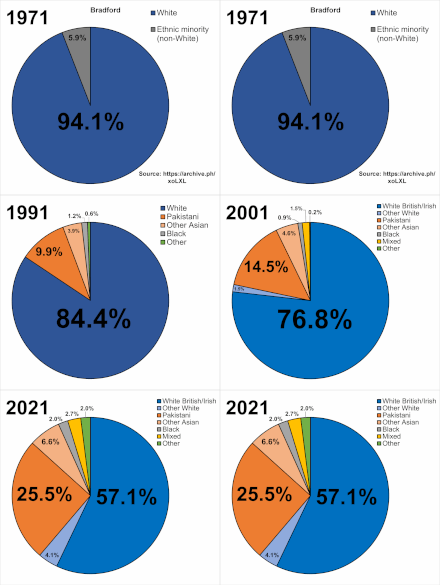


The following table shows the ethnic group of respondents in the 1991, 2001 and 2011 censuses in the City of Bradford.
Bradford has had a significant Pakistani population since post war migration began, making up around 20.4% according to the 2011 census. This increase in Pakistanis has generally provided the majority of the growth of the multi-ethnic group of Asian British people within the city. Around 63.9% of the population identify as White British. The black population of Bradford is small, making up just 1.8% of the overall population.
| Ethnic Group | Year | |||||||||||||||
|---|---|---|---|---|---|---|---|---|---|---|---|---|---|---|---|---|
| 1961 estimations[3] | 1964 estimations[4] | 1971 estimations[5] | 1981 estimations[6] | 1991 census[7] | 2001 census[8] | 2011 census[9] | 2021 census[10] | |||||||||
| Number | % | Number | % | Number | % | Number | % | Number | % | Number | % | Number | % | Number | % | |
| White: Total | – | – | – | – | 421,351 | 94.2% | 404,500 | 87% | 386,025 | 84.4% | 366,041 | 78.27% | 352,317 | 67.44% | 334,004 | 61.1% |
| White: British | – | – | – | – | – | – | – | – | – | – | 355,684 | 76.06% | 333,628 | 63.86% | 309,912 | 56.7% |
| White: Irish | – | – | – | – | – | – | – | – | 4,759 | 1.04% | 3,479 | 0.74% | 2,541 | 0.49% | 2,139 | 0.4% |
| White: Gypsy or Irish Traveller[note 1] | – | – | – | – | – | – | – | – | – | – | – | – | 433 | 0.08% | 849 | 0.2% |
| White: Roma | – | – | – | – | – | – | – | – | – | – | – | – | – | – | 1,583 | 0.3% |
| White: Other | – | – | – | – | – | – | – | – | – | – | 6,878 | 1.47% | 15,715 | 3.01% | 19,521 | 3.6% |
| Asian or Asian British: Total | – | – | – | – | – | – | 48,800 | 10.5% | 62,963 | 13.79% | 89,293 | 19.09% | 140,149 | 26.83% | 175,664 | 32.1% |
| Asian or Asian British: Indian | – | – | – | – | 7,748[11] | 1.7% | 12,900 | 2.8% | 11,713 | 2.56% | 12,504 | 2.67% | 13,555 | 2.59% | 14,429 | 2.6% |
| Asian or Asian British: Pakistani | 7,000 | 1.6% | 10,000 | – | – | – | 33,600 | 7.2% | 45,280 | 9.9% | 67,994 | 14.54% | 106,614 | 20.41% | 139,553 | 25.5% |
| Asian or Asian British: Bangladeshi | – | – | 1,500 | – | – | – | 2,300 | 0.5% | 3,653 | 0.79% | 4,967 | 1.06% | 9,863 | 1.89% | 12,403 | 2.3% |
| Asian or Asian British: Chinese[note 2] | – | – | – | – | – | – | – | – | 720 | 0.15% | 896 | 0.19% | 2,086 | 0.40% | 1,345 | 0.2% |
| Asian or Asian British: Other Asian | – | – | – | – | – | – | – | – | 1,597 | 0.34% | 2,932 | 0.63% | 8,031 | 1.54% | 7,934 | 1.5% |
| Black or Black British: Total | – | – | – | – | – | – | 6,200 | 1.3% | 5,336 | 1.16% | 4,333 | 0.93% | 9,267 | 1.77% | 10,978 | 2% |
| Black or Black British: African | – | – | – | – | – | – | – | – | 610 | 0.13% | 970 | 0.21% | 4,993 | 0.96% | 7,061 | 1.3% |
| Black or Black British: Caribbean | – | – | – | – | – | – | – | – | 3,323 | 0.72% | 3,038 | 0.65% | 3,581 | 0.69% | 2,614 | 0.5% |
| Black or Black British: Other Black | – | – | – | – | – | – | – | – | 1,403 | 0.3% | 325 | 0.07% | 693 | 0.13% | 1,303 | 0.2% |
| Mixed: Total | – | – | – | – | – | – | – | – | – | – | 6,937 | 1.48% | 12,979 | 2.48% | 15,006 | 2.7% |
| Mixed: White and Black Caribbean | – | – | – | – | – | – | – | – | – | – | 2,611 | 0.56% | 4,663 | 0.89% | 4,426 | 0.8% |
| Mixed: White and Black African | – | – | – | – | – | – | – | – | – | – | 449 | 0.10% | 875 | 0.17% | 1,196 | 0.2% |
| Mixed: White and Asian | – | – | – | – | – | – | – | – | – | – | 2,926 | 0.63% | 5,677 | 1.09% | 6,458 | 1.2% |
| Mixed: Other Mixed | – | – | – | – | – | – | – | – | – | – | 951 | 0.20% | 1,764 | 0.34% | 2,926 | 0.5% |
| Other: Total | – | – | – | – | – | – | 5,350 | 1.2% | 3,020 | 0.66% | 1,061 | 0.23% | 7,740 | 1.48% | 10,760 | 2% |
| Other: Arab[note 3] | – | – | – | – | – | – | – | – | – | – | – | – | 3,714 | 0.71% | 2,734 | 0.5% |
| Other: Any other ethnic group | – | – | – | – | – | – | 5,350 | 1.2% | 3,020 | 0.66% | 1,061 | 0.23% | 4,026 | 0.77% | 8,026 | 1.5% |
| Ethnic minority: Total | – | – | – | – | 26,195 | 5.8% | 60,350 | 13% | 71,319 | 15.6% | 101,624 | 21.7% | 170,135 | 32.6% | 212,408 | 38.9% |
| Total | 447,546 | 100% | – | – | 451,753 | 100% | 464,850 | 100% | 457,344 | 100% | 467,665 | 100% | 522,452 | 100% | 546,412 | 100% |
Notes for table above
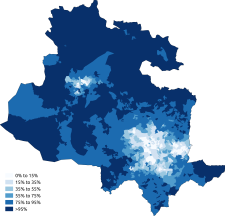
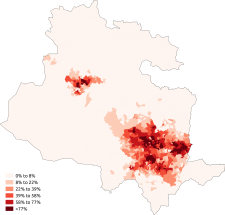
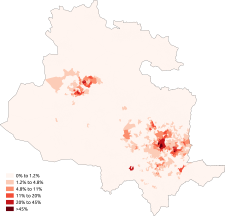
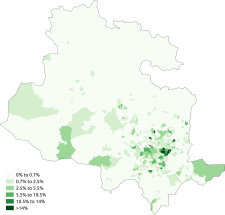
- Population pyramids of ethnicities in Bradford in 2021
- White British
- Asian: Total
- Asian: Pakistani
Ethnicity of school pupils
The ethnicity of school pupils within Bradford has been in flux, with the native White British population declining from a majority of 61.7% in 2004 to a minority of 40.1% of the total school pupil population. This shift has turned Bradford's schools into a majority-minority state, where there are no overall majorities. Asian British school children have risen from 33.1% of the school pupil population to a stagnate 42.7% in 2022, having declined the previous two years from 43.1% in 2020. The largest group within this multi-ethnic amalgamation is British Pakistanis at 36.4% of the total school population. Black British school pupils have risen slightly from 1% to 1.9% with the majority of growth coming from Black Africans. Other groups such as Other ethnicities, Other Whites and Mixed people have also increased as well.
| Ethnic group | School year[12][13] | |||||||||||||||
|---|---|---|---|---|---|---|---|---|---|---|---|---|---|---|---|---|
| 1967[14] | 1971[15] | 2004 | 2008 | 2012 | 2015/16 | 2019/20 | 2021/2022 | |||||||||
| Number | % | Number | % | Number | % | Number | % | Number | % | Number | % | Number | % | Number | % | |
| White: Total | – | 93.3% | – | 89.5% | 45,930 | 62.6% | 41,380 | 56% | 39,320 | 51.1% | 40,978 | 48.7% | 46,896 | 46.3% | 46,157 | 45.5% |
| White: British | – | – | – | – | 45,300 | 61.7% | 40,027 | 54.2% | 36,885 | 47.9% | 36,629 | 43.6% | 41,350 | 40.9% | 40,577 | 40.1% |
| White: Irish | – | – | – | – | 90 | 85 | 94 | 96 | 0.1% | 115 | 0.1% | 113 | 0.1% | |||
| White: Traveller of Irish heritage | – | – | – | – | 20 | 21 | 36 | 31 | 0.0% | 28 | 0.0% | 37 | 0.0% | |||
| White: Gypsy/Roma | – | – | – | – | 70 | 166 | 494 | 1,260 | 1.5% | 1,140 | 1.1% | 1,031 | 1.0% | |||
| White: Other | – | – | – | – | 450 | 0.6% | 1,082 | 1,809 | 2,962 | 3.5% | 4,263 | 4.2% | 4,399 | 4.3% | ||
| Asian / Asian British: Total | – | – | – | – | 24,280 | 33.1% | 28,387 | 38.4% | 32,704 | 42.5% | 36,353 | 43.3% | 43,447 | 43.1% | 43,268 | 42.7% |
| Asian / Asian British: Indian | – | – | – | – | 1,790 | 2.4% | 1,839 | 1,838 | 1,809 | 2.2% | 1,982 | 2.0% | 1,974 | 1.9% | ||
| Asian / Asian British: Pakistani | – | – | – | – | 20,160 | 27.5% | 23,241 | 31.5% | 26,727 | 34.7% | 30,674 | 36.5% | 36,849 | 36.5% | 36,841 | 36.4% |
| Asian / Asian British: Bangladeshi | – | – | – | – | 1,750 | 2,141 | 2,518 | 2,851 | 3.4% | 3,315 | 3.3% | 3,153 | 3.1% | |||
| Asian / Asian British: Chinese | – | – | – | – | 80 | 85 | 110 | 88 | 0.1% | 98 | 0.1% | 97 | 0.1% | |||
| Asian / Asian British: Other Asians | – | – | – | – | 500 | 1,081 | 1,511 | 931 | 1.1% | 1,203 | 1.2% | 1,203 | 1.2% | |||
| Black / Black British: Total | – | – | – | – | 700 | 1% | 940 | 1.3% | 1,015 | 1.3% | 1,170 | 1.4% | 1,762 | 1.7% | 1,954 | 1.9% |
| Black: Caribbean | – | – | – | – | 340 | 326 | 309 | 284 | 0.3% | 252 | 0.2% | 215 | 0.2% | |||
| Black: African | – | – | – | – | 270 | 0.4% | 488 | 577 | 815 | 1.0% | 1,316 | 1.3% | 1,515 | 1.5% | ||
| Black: Other Blacks | – | – | – | – | 90 | 118 | 131 | 107 | 0.1% | 194 | 0.2% | 224 | 0.2% | |||
| Mixed / British Mixed | – | – | – | – | 1,800 | 2.5% | 2,390 | 3.2% | 2,900 | 3.8% | 3,903 | 4.6% | 6,124 | 6.0% | 6,550 | 6.5% |
| Other: Total | – | – | – | – | 250 | 0.3% | 557 | 0.8% | 760 | 1% | 961 | 1.1% | 1,566 | 1.5% | 1,880 | 1.9% |
| Unclassified | – | – | – | – | 430 | 0.6% | 20 | – | 225 | 0.3% | 592 | 0.7% | 1,261 | 1.2% | 1,500 | 1.5% |
| Non-White: Total | – | 6.7% | – | 10.5% | 37.4% | 44% | 48.9% | 51.3% | 53.7% | 54.5% | ||||||
| Total: | – | 100% | – | 100% | 73,380 | 100% | 73,860 | 100% | 76,930 | 100% | 83,993 | 100% | 101,056 | 100% | 101,309 | 100% |
Country of birth

| Country of birth | Year | |||||
|---|---|---|---|---|---|---|
| 1961 census[16] | 1981 census[17] | 2021 census[18] | ||||
| Number | % | Number | % | Number | % | |
| – | 95.4% | 409,202 | 90.1% | 444,478 | 81.3% | |
| Foreign born | – | 4.6% | 44,990 | 9.9% | 101,938 | 18.7% |
| Total | – | 100% | 454,192 | 100% | 546,416 | 100% |
Languages
The most common main languages spoken in the City of Bradford according to the 2011 census are shown below.[19]
| Rank | Language | Usual residents aged 3+ | Proportion |
|---|---|---|---|
| 1 | English | 424,527 | 85.31% |
| 2 | Punjabi | 19,842 | 3.99% |
| 3 | Urdu | 16,550 | 3.33% |
| 4 | Polish | 5,526 | 1.11% |
| 5 | Bengali (incl. Sylheti and Chatgaya) | 4,743 | 0.95% |
| 6 | Pashto | 3,580 | 0.72% |
| 7 | Gujarati | 2,638 | 0.53% |
| 8 | Arabic | 2,398 | 0.48% |
| 9 | Slovak | 2,162 | 0.43% |
| 10 | Kurdish | 1,275 | 0.26% |
| 11 | Pakistani Pahari (incl. Mirpuri and Potwari) | 1,048 | 0.21% |
| 12 | Latvian | 985 | 0.20% |
| 13 | Russian | 690 | 0.14% |
| 14 | Czech | 642 | 0.13% |
| 15 | Tagalog/Filipino | 640 | 0.13% |
| 16 | Persian | 592 | 0.12% |
| 17 | Italian | 564 | 0.11% |
| 18 | French | 443 | 0.09% |
| 19 | Lithuanian | 436 | 0.09% |
| 20 | Greek | 382 | 0.08% |
| Other | 7,945 | 1.60% |
Religion
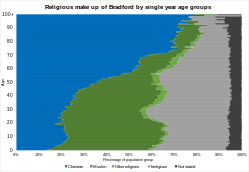
The following table shows the religion of respondents in the 2001, 2011 and 2021 censuses in the City of Bradford.
| Religion | 1980 estimates[20] | 1989 estimations[21] | 2001[22] | 2011[23] | 2021[24] | |||||
|---|---|---|---|---|---|---|---|---|---|---|
| Number | % | Number | % | Number | % | Number | % | Number | % | |
| Holds religious beliefs | – | – | – | – | 367,518 | 78.58 | 381,876 | 73.09 | 362,291 | 66.3 |
| – | – | – | – | 281,236 | 60.14 | 239,843 | 45.91 | 182,566 | 33.4 | |
| 45,000 | – | 50,000 | – | 75,188 | 16.08 | 129,041 | 24.70 | 166,846 | 30.5 | |
| – | – | – | – | 4,748 | 1.02 | 5,125 | 0.98 | 4,834 | 0.9 | |
| – | – | – | – | 4,457 | 0.95 | 4,882 | 0.93 | 4,757 | 0.9 | |
| – | – | – | – | 537 | 0.11 | 1,000 | 0.19 | 959 | 0.2 | |
| – | – | – | – | 356 | 0.08 | 299 | 0.06 | 254 | <0.1 | |
| Other religion | – | – | – | – | 996 | 0.21 | 1,686 | 0.32 | 2,074 | 0.4 |
| No religion | – | – | – | – | 62,266 | 13.31 | 108,027 | 20.68 | 154,305 | 28.2 |
| Religion not stated | – | – | – | – | 37,921 | 8.11 | 32,549 | 6.23 | 29,816 | 5.5 |
| Total population | – | – | – | – | 467,655 | 100.0 | 522,452 | 100.0 | 546,412 | 100.0 |
Industry

Manufacturing in Bradford has collapsed since the middle half of the 20th century.
See also
- Demographics of West Yorkshire
- Demographics of the United Kingdom
- Demographics of England
- Demographics of London
- Demographics of Birmingham
- Demographics of Greater Manchester
- List of English cities by population
- List of English districts by population
- List of English districts and their ethnic composition
- List of English districts by area
- List of English districts by population density
References
- ^ "2011 Built-up Areas – Methodology and Guidance" (PDF). Office for National Statistics. 2013. Archived from the original (PDF) on 7 October 2021. Retrieved 7 October 2021.
- ^ UK Census (2011). "Local Area Report – Bradford Built-up area sub division (E35001211)". Nomis. Office for National Statistics. Retrieved 7 October 2021.
- ^ Welshman, John (2001). "Tuberculosis and ethnicity in England and Wales, 1950–70". Sociology of Health & Illness. 22 (6): 858–882. doi:10.1111/1467-9566.00234. ISSN 0141-9889.
- ^ "Urban Ethnicity". Routledge & CRC Press. p. 80. Retrieved 8 June 2024.
- ^ Jones, P. N. (1978). "The Distribution and Diffusion of the Coloured Population in England and Wales, 1961–71". Transactions of the Institute of British Geographers. 3 (4): 515–532. Bibcode:1978TrIBG...3..515J. doi:10.2307/622127. ISSN 0020-2754. JSTOR 622127. PMID 12157820.
- ^ Simpson, Ludi (March 2004). "Statistics of Racial Segregation: Measures, Evidence and Policy". Urban Studies. 41 (3): 661–681. Bibcode:2004UrbSt..41..661S. doi:10.1080/0042098042000178735. ISSN 0042-0980. S2CID 154380697.
- ^ Data is taken from United Kingdom Casweb Data services of the United Kingdom 1991 Census on Ethnic Data for England, Scotland and Wales Archived 5 April 2022 at the Wayback Machine (Table 6)
- ^ "Office of National Statistics; 2001 Census Key Statistics". webarchive.nationalarchives.gov.uk. Retrieved 7 September 2021.
- ^ "2011 Census: Ethnic Group, local authorities in England and Wales". webarchive.nationalarchives.gov.uk. Retrieved 15 December 2021.
- ^ "Ethnic group – Office for National Statistics". www.ons.gov.uk. Retrieved 29 November 2022.
- ^ Rees, P. H.; Ram, S. (1987). "Projections of the Residential Distribution of an Ethnic Group: Indians in Bradford". Environment and Planning A: Economy and Space. 19 (10): 1323–1358. Bibcode:1987EnPlA..19.1323R. doi:10.1068/a191323. ISSN 0308-518X.
- ^ "School and pupil characteristics". webarchive.nationalarchives.gov.uk. Retrieved 8 November 2022.
- ^ "Schools, pupils and their characteristics, Academic Year 2021/22". explore-education-statistics.service.gov.uk. Retrieved 9 September 2022.
- ^ "Immigrant Pupils (Hansard, 15 February 1968)". api.parliament.uk. Retrieved 11 June 2024.
- ^ "Immigrants – Volume 837: debated on Monday 22 May 1972 – Hansard".
- ^ Coates, Bryan E. (1968). "The Distribution of the Overseas-Born Population of the British Isles". Transactions of the Institute of British Geographers (43): 37–43. doi:10.2307/621485. ISSN 0020-2754. JSTOR 621485.
- ^ "1981 census - small area statistics - Nomis - Official Census and Labour Market Statistics". www.nomisweb.co.uk. Retrieved 25 April 2023.
- ^ "TS004 – Country of birth – Nomis – Official Census and Labour Market Statistics". www.nomisweb.co.uk. Retrieved 22 April 2023.
- ^ "Download:local authorities: county / unitary". NOMIS. Retrieved 17 June 2015.
- ^ Smith, P. R. (1980). "The Islamic environment in a British city — a case study of Leicester (extract)". Ekistics. 47 (280): 79–83. ISSN 0013-2942. JSTOR 43619730.
- ^ Le Lohé, M. J. (October 1989). "Political issues". Journal of Ethnic and Migration Studies. 16 (1): 137–144. doi:10.1080/1369183X.1989.9976165. ISSN 1369-183X.
- ^ "KS007 - Religion - Nomis - 2001". www.nomisweb.co.uk. Retrieved 18 October 2022.
- ^ "KS209EW (Religion) – Nomis – 2011". www.nomisweb.co.uk. Retrieved 18 October 2022.
- ^ "Religion – 2021 census". Office of National Statistics. 29 November 2022. Archived from the original on 29 November 2022. Retrieved 16 December 2022.

