Ethnic groups in South Africa
| Part of a series on the |
| Culture of South Africa |
|---|
 |
| People |
| Cuisine |
| Religion |
| Art |
| Sport |

Ethnic groups in South Africa have a variety of origins. The racial categories introduced by the colonial apartheid regime remain ingrained in South African society[1][2][3][4] with the governing party of South Africa, the African National Congress (ANC) continuing to classify the population as belonging to one of the four colonial-era constructed racial groups: Whites, Indians, Coloureds and Blacks.[4][3]
The ANC government claims that using these categories is essential in order to identify and track the progress of Historically Disadvantaged Individuals (HDI) which are people who, before democratisation and the Constitution of the Republic of South Africa, 1993 (Act No. 200 of 1993), came into operation, were disadvantaged by unfair discrimination on the basis of race under the former colonial apartheid regime.[5][6]
The National Census of 1996 was the 1st comprehensive national census by the ANC government, after the democratic transition. Statistics South Africa (SSA) provides the limited categories based on the classifications of the previous regime by which people must use to classify themselves, including a fifth category of "unspecified/other".[7]
| Category | 1996 | 2001 | 2011 | 2022 | Change |
|---|---|---|---|---|---|
| African | 76,7% | 68,4% | 79,2% | 81,4% | 2,2% |
| Coloured | 10,9% | 7,7% | 8,9% | 8,2% | 0,72% |
| White | 8,9% | 8,3% | 8,9% | 7,3% | 1,6% |
| Asian or Indian | 2,6% | 2,2% | 2,5% | 2,7% | 0,2% |
| Other | No Data | No Data | 0,5% | 0,4% | 0,1% |
| Total population | 40 600 000 | 44 819 778 | 51 770 560 | 62 027 503 | 14,39% |
'Black' South Africans
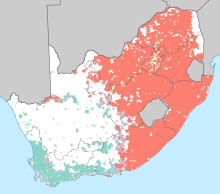
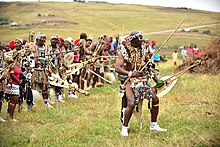
The majority population of South Africa are those who identify themselves as 'Black' Africans or 'Black' people of South Africa, who are culturally and linguistically heterogeneous. They include Zulu, Xhosa, BaPedi (North Sotho), BaTswana, BaSotho (South Sotho), Tsonga, Swazi, Venda and South Ndebele people, all of whom are represented in the languages of South Africa. According to the 2022 census, the twelve official languages according to usage are: isiZulu 24,4%, isiXhosa 16,3%, Afrikaans 10,6%, English 8,7%, Sepedi 10,0%, Setswana 8,3%, Sesotho 7,8%, Xitsonga 4,7%, siSwati 2,8%, Tshivenda 2,5%, isiNdebele 1,7% and South African Sign Language.[12]
These cultural groups are also found across southern Africa. The BaSotho are the majority ethnic group of Lesotho. The Tswana make up the majority of the population of Botswana. The Swazi are the majority in Swaziland. The Tsonga are also found in Southern Mozambique.

The term African in South Africa generally refers to individuals who can trace their ancestral lineage exclusively on the continent, excluding Europe, Oceania, the Americas or Asia.[citation needed]
Demographics
As of the calculations of 2004, there were 34 216 164 people and 8 625 050 households in this category. Their population density is 29/km2 and the density of 'Black' households is 7/km2. They made up 79% of the total population of South Africa in 2011 and 81% in 2016.[13] The percentage of all 'Black' households that are made up of individuals is 19.9%. The average household size is 4.11 members.[citation needed]
This population is dispersed across South Africa with 34 under the age of 15, 21,6% from 15 to 24, 28,3% from 25 to 44, 11.8% from 45 to 64 and 4,3% who are 65 years of age or older. The median age of a 'Black' South African is 21 years. For every 100 females there are 91,1 males. For every 100 females age 18 and over, there are 86,2 males.[14]
With regard to education, 22,3% of 'Black' people aged 20 and over have received no schooling, 18,5% have had some primary, 6,9% have completed only primary school, 30,4% have had some high education, 16,8% have finished only high school and 5,2% have an education higher than the high school level. Overall, 22% of 'Black' people have completed high school and 59% aged 25 to 64, have an upper secondary education as their highest level of education. This places South Africa above the G20 average of 32% and the OECD average of 38%.[15]
The percentage of housing units having a telephone and/or mobile phone in the dwelling is 31,1%. The percentage having access to a nearby phone is 57,2%, and 11,7% do not have nearby access or any access. The percentage of households that have a flush or chemical toilet is 41,9%. Refuse is removed from 45,3% of 'Black' households by the municipality at least once a week and 11% have no rubbish disposal. Some 17,9% have running water inside their dwelling, 51,7% have running water on their property and 80.2% have access to running water. The percentage of 'Black' households using electricity for cooking is 39,3%, for heating, 37,2% and for lighting, 62%. Radios are owned by 68,7% of Black households while 44,2% have a television, 1,8% own a computer, 40% have a refrigerator and 24,6% have a mobile phone.[citation needed]
'The unemployment rate of the 'Black' population aged 15–65 is 28,1%. The median annual income of Black working adults aged 15–65 is ZAR 12 073. Males have a median annual income of ZAR 14 162 versus ZAR 8 903 for females.[16]
'Coloured' South Africans
The 'Coloured' population include people of mixed heritage who are concentrated in the Cape region, who can have as many as 140 or more ethnicities identified in their DNA.[17]
It is important to understand that today, not all people of multiracial heritage in South Africa identify as 'Coloured'. Some individuals of mixed heritage prefer to identify as 'Black, 'White', Indian or indigenous[18] South Africans for example, as they are now free to choose. However, during the apartheid era this categorisation was enforced by law for anyone who was determined to be of multiracial descent by the government.[citation needed] This cultural group doesn't have a particular language or traditions because their identity stems from their shared history and sense of community. Although they are an extremely diverse group, many speak Afrikaans as a first language.[citation needed]
The Cape 'Coloureds' originally descended sexual unions of European colonists with indigenous, African and Asian (ie: Javanese, Malay, Indian, Malagasy) slaves or indentured labourers. The Cape Malay identity, which was considered a subgroup of 'Coloured' under the apartheid regime, was generally held to encompass people of multiracial heritage from the Cape who practised Islam.[citation needed]
There is also a significant group of Chinese South Africans (approximately 300 000 or more). They were also classified as a subgroup of 'Coloured' under apartheid.[citation needed] In 2008, the Pretoria High Court ruled that the descendants of mainland Chinese who arrived before 1994, and had been classified as a subgroup of 'Coloured' by the apartheid government, were eligible for redress. As a result of this ruling, about 12 000–15 000[19] ethnically Chinese citizens who arrived before 1994, numbering 3%–5% of the total Chinese population in the country are now included in the HDI group and benefit from government BEE policies.[20]
However, other Asian cultural groups such as Hong Kongers, Taiwanese and Japanese South Africans were categorised as honorary whites during apartheid.[21]

Within the Coloured community, more recent immigrants will also be found i.e. Coloureds from the former Rhodesia (now Zimbabwe); Namibia and immigrants of mixed descent from India (such as Anglo-Indians) who were welcomed to the Cape when India and Burma received their Independence.[22]
White South Africans

This group consists predominantly of Dutch, German, French Huguenot, English, Portuguese and other European descendants.[17][23] Culturally and linguistically, they are divided into Afrikaans-speaking and English-speaking groups.[citation needed] According to the 2022 census, one of the top three most spoken languages is Afrikaans (10,6%).
The first census in South Africa in 1911 showed that 'Whites' made up 22% of the population; who declined to 16% in 1980.[24] The 'white' population decreased further in the 1990s and 2000s due to a low birth rate and emigration.[citation needed] As a factor in their decision to emigrate, many cite the high crime rate, affirmative action policies and racial discrimination.[25][26] From 1994 to 2010, approximately 400,000 'Whites' permanently emigrated.[10]
Despite high emigration levels among South Africans of European descent, new immigrants from Europe or the diaspora have desired to settle in the country.
In the 1970s, many European descendants living in Portuguese colonies such as Angola and Mozambique moved to South Africa after the independence of those nations.[citation needed] Many Zimbabweans and Kenyans of British descent also immigrated to South Africa - many of whom lament the loss of their colonial lifestyles are called "Whenwees" because they’re always talking about "When we were in..."[27]
In the 1980s and early 1990s the apartheid regime encouraged immigration particularly from Poland, Hungary, Turkey, Azerbaijan, and Armenia. By 2005, an estimated 212 000 British citizens had sought out new lives in South Africa, growing up to 500 000 by 2011.[28]
Between 2000 and 2010 South Africans of European descent returned in large numbers. By May 2014, it was estimated that around 340 000 former South Africans had returned home after immigrating elsewhere in the preceding decade.[29]
Demographics
As of the census of 2001, there are 4 293 638 'Whites' and 1 409 690 households in South Africa. Their population density is 4/km2 and the density of their households is 1,16/km2. They made up 9,6% of the total population.
The percentage of all 'White' households that are made up of individuals is 19,1%. The average household size is 3,05 members. In South Africa, this population is spread out, with 19% under the age of 15, 15.1% from 15 to 24, 31.0% from 25 to 44, 23.8% from 45 to 64, and 11,1% who are 65 years of age or older. The median age of a 'White' person is 35 years. For every 100 females there are 94 males. For every 100 females age 18 and over, there are 91,1 males.
With regards to education, 1,4% of 'Whites' aged 20 and over have received no schooling, 1,2% have had no more than some primary school education, 0,8% have only completed primary school, 25,9% have had no more than some high school education, 41,3% have finished only high school, and 29,8% have an education higher than the high-school level. Overall, 70,7% of Whites have completed high school.
The percentage of housing units having a telephone and/or mobile phone in the dwelling is 95,4%. The percentage having access to a nearby phone is 4,4%, and 0,2% do not have nearby access or any access. The percentage of White households that have a flush or chemical toilet is 98,7%. Waste is removed from 90,8% of White households by the municipality at least once a week, and 0,5% have no rubbish disposal. Some 87,2% of White have running water inside their dwelling, 95,6% have running water on their property, and 99,4% have access to running water. The percentage of households using electricity for cooking is 96,6%, for heating, 93,2%, and for lighting, 99,2%. Radios are owned by 94,7% of households while 92,6% have a television, 46% own a computer, 97,6% have a refrigerator, and 74,6% have a mobile phone.
The unemployment rate of the 'White' population aged 15–65 is 4,1%. The median annual income of working adults aged 15–65 is ZAR 65 000. 'White' males have a median annual income of ZAR 81 701 versus ZAR 52 392 for females.[citation needed]
Indian South Africans

Descendants of migrants from British India in the late 19th and early 20th century[17] have an estimated population of 1,2 million or 2,5% of the South African population; many of whom descended from indentured workers brought in the nineteenth century to work on the sugar plantations of the eastern coastal area of Natal and adhered to different religions and spoke different languages.[17] A smaller group, referred to as Passenger Indians came independently for work purposes and business interests at around the same time.[citation needed]
Other cultural groups
Indigenous South Africans
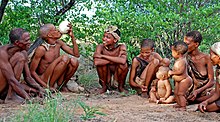
The Khoikhoi and San people of South Africa are a minority indigenous population. The Khoikhoi were pastoralists and extensively integrated into the colonial economy, many converting early to Christianity. [citation needed] The San people were hunter-gatherers.[citation needed] These groups were not identified as Black South African, African or Black African by the colonists. In the 2011 census for example, the overwhelming majority of the San community in Platfontein originating from the northern parts of Namibia and southern Angola opted to be classified as 'Other' whereas descendants of Namaqualand Khoikhoi classify themselves as Coloured.[18]

Lemba
There is a small but notable population of Lemba people who live primarily in the north eastern regions of South Africa who have Bantu and Semitic origins.[citation needed]
Romani
A small population of Kalderash Roma people have also made South Africa their home.[30][31]
Recent immigrants
Zimbabweans, Somalis, Ethiopians, Bangladeshis, Pakistanis and Nigerians constitute the largest migrant communities in the last two decades. There are also Vietnamese, Koreans and Filipinos in South Africa.[citation needed]
Population growth
Between 2009 and 2016, South Africa's population increased by 11,6% from an estimated 49,9 million to an estimated 55,7 million.[32][33]
| Year | 'Black' | 'Coloured' | 'White' | Indian/Asian | Total | |||||
|---|---|---|---|---|---|---|---|---|---|---|
| Pop. | ±% p.a. | Pop. | ±% p.a. | Pop. | ±% p.a. | Pop. | ±% p.a. | Pop. | ±% p.a. | |
| 1996 | 31 127 631 | — | 3 600 446 | — | 4 434 697 | — | 1 045 596 | — | 40 583 573 | — |
| 2001 | 35 416 166 | +2,6% | 3 994 505 | +2,1% | 4 293 640 | −3,2% | 1 115 467 | +6,7% | 44 819 778 | +10,4% |
| 2011 | 41 000 938 | +1,5% | 4 615 401 | +1,5% | 4 586 838 | +6,8% | 1 286 930 | +15,4% | 51 770 560 | +15,5% |
| 2014 | 43 333 700 | +1,9% | 4 771 500 | +1,1% | 4 554 800 | −0,7% | 1 341 900 | +4,3% | 54 002 000 | +4,3% |
See also
- South African National Census of 1996
- South African National Census of 2001
- South African National Census of 2011
- South African National Census of 2022
- Demographics of South Africa
External links
References
- ^ Rondganger, Lee (6 June 2006). "Being an African makes me who I am". IOL. Retrieved 9 March 2013.
- ^ du Preez, Max (9 March 2011). "Are we all 'coloured'?". News24. Retrieved 9 March 2013.
- ^ a b Posel, Deborah (2001). "What's in a name? Racial categorisations under apartheid and their afterlife" (PDF). Transformation: 50–74. ISSN 0258-7696. Archived from the original (PDF) on 8 November 2006.
- ^ a b Pillay, Kathryn (2019). "Indian Identity in South Africa". The Palgrave Handbook of Ethnicity. pp. 77–92. doi:10.1007/978-981-13-2898-5_9. ISBN 978-981-13-2897-8.
- ^ as per 2021 Guidelines published by the Department of Trade, Industry and Competition in RSA
- ^ Lehohla, Pali (5 May 2005). "Debate over race and censuses not peculiar to SA". Business Report. Archived from the original on 14 August 2007. Retrieved 25 August 2013.
Others pointed out that the repeal of the Population Registration Act in 1991 removed any legal basis for specifying 'race'. The Identification Act of 1997 makes no mention of race. On the other hand, the Employment Equity Act speaks of 'designated groups' being 'black people, women and people with disabilities'. The Act defines 'black' as referring to 'Africans, coloureds and Indians'. Apartheid and the racial identification which underpinned it explicitly linked race with differential access to resources and power. If the post-apartheid order was committed to remedying this, race would have to be included in surveys and censuses, so that progress in eradicating the consequences of apartheid could be measured and monitored. This was the reasoning that led to a 'self-identifying' question about 'race' or 'population group' in both the 1996 and 2001 population censuses, and in Statistics SA's household survey programme.
- ^ Census 2001 Archived 10 August 2007 at the Wayback Machine, Statistics South Africa.
- ^ Primary tables South Africa: Census '96 and 2001 compared (PDF). Statistics South Africa. 2004. pp. 4–5. ISBN 0-621-34320-X. Retrieved 24 November 2015.
- ^ Census in brief (PDF). Statistics South Africa. 2003. ISBN 0-621-34293-9. Retrieved 24 November 2015.
- ^ a b Census in brief (PDF). Statistics South Africa. 2012. p. 21. ISBN 978-0-621-41388-5.
- ^ Census 2022: Statistical Release P0301.4 Statistics South Africa. Retrieved 16 August 2024
- ^ "The NA approves South African Sign Language as the 12th official language" (Press release).
- ^ "StatsSA" (PDF). StatsSA. Retrieved 14 February 2021.
- ^ Adams, Byron G.; Van de Vijver, Fons J.R.; De Bruin, Gideon P. (May 2012). "Identity in South Africa: Examining self-descriptions across ethnic groups". International Journal of Intercultural Relations. 36 (3): 377–388. doi:10.1016/j.ijintrel.2011.11.008. ISSN 0147-1767.
- ^ “Education at a Glance: South Africa”. OECD. 2019. https://www.oecd.org/education/education-at-a-glance/EAG2019_CN_ZAF.pdf
- ^ "Unemployment, race and poverty in South Africa". Archived from the original on 18 November 2019. Retrieved 16 April 2014.
- ^ a b c d Kristin Henrard (2002). Minority Protection in Post-Apartheid South Africa: Human Rights, Minority Rights, and Self-Determination. Greenwood Publishing Group. p. 43. ISBN 978-0-275-97353-7.
- ^ a b "Platfontein 2011 census results".
- ^ Conason, Joe (19 June 2008). "Chinese declared black". Salon.com. Retrieved 30 May 2010.
- ^ We agree that you are black, South African court tells Chinese, The Times
- ^ Kim, Young-Chan (20 January 2017). China and Africa: A New Paradigm of Global Business. Springer. p. 84. ISBN 9783319470306.
- ^ Suttner, Raymond (November 2009). "The Zuma Era – Its Historical Context and the Future". African Historical Review. 41 (2): 28–59. doi:10.1080/17532521003607286. ISSN 1753-2523. S2CID 144543571.
- ^ Gibson, James L.; Gouws (2005). Overcoming Intolerance in South Africa: Experiments in Democratic Persuasion. Cambridge University Press. p. 36. ISBN 978-0-521-67515-4.
- ^ South Africa: time running out : the report of the Study Commission on U.S. Policy Toward Southern Africa. University of California Press. 1981. p. 42. ISBN 0-520-04547-5.
- ^ "The New Great Trek – The Story of South Africa's White Exodus". Unisa.ac.za. Retrieved 30 October 2011.
- ^ "Policy Series". Queensu.ca. 7 October 1997. Archived from the original on 29 October 2011. Retrieved 30 October 2011.
- ^ "Rhodie oldies". New Internationalist. 1985. Archived from the original on 4 September 2009. Retrieved 29 October 2007.
- ^ "Britons living in SA to enjoy royal wedding". Eyewitness News. 28 April 2011. Archived from the original on 21 January 2012.
- ^ Jane Flanagan (3 May 2014). "Why white South Africans are coming home". Bbc.co.uk. Archived from the original on 3 May 2014. Retrieved 15 January 2016.
- ^ Chesterton, G. K. (March 2022). Orthodoxy. B&H Publishing. ISBN 978-1-5359-9568-9. OCLC 1299383669.
- ^ Historical Dictionary of the Gypsies (Romanies) (PDF). p. 258.
- ^ Johnson, Leigh F.; May, Margaret T.; Dorrington, Rob E.; Cornell, Morna; Boulle, Andrew; Egger, Matthias; Davies, Mary-Ann (12 December 2017). "Estimating the impact of antiretroviral treatment on adult mortality trends in South Africa: A mathematical modelling study". PLOS Medicine. 14 (12): e1002468. doi:10.1371/journal.pmed.1002468. ISSN 1549-1676. PMC 5726614. PMID 29232366.
- ^ Osman, Muhammad; van Schalkwyk, Cari; Naidoo, Pren; Seddon, James A.; Dunbar, Rory; Dlamini, Sicelo S.; Welte, Alex; Hesseling, Anneke C.; Claassens, Mareli M. (5 August 2021). "Mortality during tuberculosis treatment in South Africa using an 8-year analysis of the national tuberculosis treatment register". Scientific Reports. 11 (1): 15894. Bibcode:2021NatSR..1115894O. doi:10.1038/s41598-021-95331-w. ISSN 2045-2322. PMC 8342475. PMID 34354135. S2CID 236933396.
