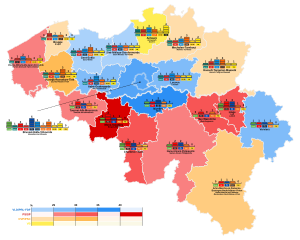
1999 Belgian federal election
| |||||||||||||||||||||||||||||||||||||||||||||||||||||||||||||||||||||||||
All 150 seats in the Chamber of Representatives 76 seats needed for a majority | |||||||||||||||||||||||||||||||||||||||||||||||||||||||||||||||||||||||||
| Turnout | 90.56% | ||||||||||||||||||||||||||||||||||||||||||||||||||||||||||||||||||||||||
|---|---|---|---|---|---|---|---|---|---|---|---|---|---|---|---|---|---|---|---|---|---|---|---|---|---|---|---|---|---|---|---|---|---|---|---|---|---|---|---|---|---|---|---|---|---|---|---|---|---|---|---|---|---|---|---|---|---|---|---|---|---|---|---|---|---|---|---|---|---|---|---|---|---|
This lists parties that won seats. See the complete results below. | |||||||||||||||||||||||||||||||||||||||||||||||||||||||||||||||||||||||||
40 of the 71 seats in the Senate 36 seats needed for a majority | |||||||||||||||||||||||||||||||||||||||||||||||||||||||||||||||||||||||||
| Turnout | 90.57% | ||||||||||||||||||||||||||||||||||||||||||||||||||||||||||||||||||||||||
This lists parties that won seats. See the complete results below.
| |||||||||||||||||||||||||||||||||||||||||||||||||||||||||||||||||||||||||
 |
|---|
|
|
Federal elections were held in Belgium on June 13, 1999 to elect members of the Chamber of Representatives and Senate.[1] The elections were held on the same day as the European elections and the regional elections. The Flemish Liberals and Democrats (VLD) became the largest party.
The Christian Democrats (CVP/PSC) suffered historic losses due to the dioxine affair that broke loose that year. Jean-Luc Dehaene's reign of eight years came to an end. Verhofstadt formed a six-party coalition comprising the liberal (VLD and PRL), socialist (SP and PS), and green parties (Agalev and Ecolo). It was the first liberal-led government since 1938, and the first since 1958 that didn't include a Christian Democratic party.
Results
Chamber of Representatives
 | |||||
|---|---|---|---|---|---|
| Party | Votes | % | Seats | +/– | |
| Flemish Liberals and Democrats | 888,861 | 14.30 | 23 | +2 | |
| Christian People's Party | 875,455 | 14.09 | 22 | –7 | |
| Parti Socialiste | 631,653 | 10.16 | 19 | –2 | |
| Liberal Reformist Party–Democratic Front of Francophones | 630,219 | 10.14 | 18 | 0 | |
| Vlaams Blok | 613,399 | 9.87 | 15 | +4 | |
| Socialistische Partij | 593,372 | 9.55 | 14 | –6 | |
| Ecolo | 457,281 | 7.36 | 11 | +5 | |
| Agalev | 434,449 | 6.99 | 9 | +4 | |
| Christian Social Party | 365,318 | 5.88 | 10 | –2 | |
| People's Union | 345,576 | 5.56 | 8 | +3 | |
| Vivant | 130,701 | 2.10 | 0 | New | |
| National Front | 90,401 | 1.45 | 1 | –1 | |
| Workers' Party of Belgium | 25,215 | 0.41 | 0 | 0 | |
| Communist Party | 23,081 | 0.37 | 0 | 0 | |
| Party for a New Politics in Belgium | 22,591 | 0.36 | 0 | New | |
| New Belgian Front | 22,491 | 0.36 | 0 | New | |
| WALLON | 11,863 | 0.19 | 0 | 0 | |
| Aging with Dignity (Flanders) | 8,033 | 0.13 | 0 | 0 | |
| FRANCE | 7,493 | 0.12 | 0 | New | |
| Alliance | 4,001 | 0.06 | 0 | New | |
| PJU–PDB | 2,945 | 0.05 | 0 | 0 | |
| Social-Liberal Democrats | 2,623 | 0.04 | 0 | New | |
| Social Democrat Party | 1,928 | 0.03 | 0 | New | |
| LEEF | 1,703 | 0.03 | 0 | New | |
| Employment is Investing in the Future | 1,610 | 0.03 | 0 | 0 | |
| Alliance for Truth and Law in Belgium | 1,597 | 0.03 | 0 | New | |
| Belgian Indian with No Name | 1,488 | 0.02 | 0 | New | |
| Noor | 1,244 | 0.02 | 0 | New | |
| Democratic Union | 1,119 | 0.02 | 0 | New | |
| For a Movement in Defence of Workers and Youth | 1,068 | 0.02 | 0 | New | |
| NP | 943 | 0.02 | 0 | New | |
| National Front – Walloon Federation | 859 | 0.01 | 0 | New | |
| Front of the Belgian Nation–Party | 671 | 0.01 | 0 | New | |
| People's Nationalist Party | 656 | 0.01 | 0 | 0 | |
| Stardust | 649 | 0.01 | 0 | New | |
| VIC | 636 | 0.01 | 0 | New | |
| Democratic Right | 607 | 0.01 | 0 | New | |
| Referendum | 601 | 0.01 | 0 | 0 | |
| Militant Left | 438 | 0.01 | 0 | New | |
| Parti Communautaire National-Européen | 399 | 0.01 | 0 | 0 | |
| Humanist Party | 369 | 0.01 | 0 | New | |
| Civic List | 242 | 0.00 | 0 | New | |
| Paradise Action Party | 105 | 0.00 | 0 | New | |
| Other parties | 8,121 | 0.13 | 0 | – | |
| Total | 6,214,074 | 100.00 | 150 | 0 | |
| Valid votes | 6,214,074 | 93.44 | |||
| Invalid/blank votes | 435,941 | 6.56 | |||
| Total votes | 6,650,015 | 100.00 | |||
| Registered voters/turnout | 7,343,464 | 90.56 | |||
| Source: Belgian Elections, Global Elections Database | |||||
Senate
 | ||||||||
|---|---|---|---|---|---|---|---|---|
| Party | Votes | % | Seats | |||||
| Won | Community | Co-opted | Total | |||||
| Flemish Liberals and Democrats | 952,116 | 15.37 | 6 | 3 | 2 | 11 | ||
| Christian People's Party | 913,508 | 14.75 | 6 | 3 | 1 | 10 | ||
| Liberal Reformist Party–Democratic Front of Francophones | 654,961 | 10.57 | 5 | 3 | 1 | 9 | ||
| Parti Socialiste | 597,890 | 9.65 | 4 | 4 | 2 | 10 | ||
| Vlaams Blok | 583,208 | 9.42 | 4 | 1 | 1 | 6 | ||
| Socialistische Partij | 550,657 | 8.89 | 4 | 1 | 1 | 6 | ||
| Ecolo | 458,658 | 7.40 | 3 | 3 | 0 | 6 | ||
| Agalev | 438,931 | 7.09 | 3 | 1 | 1 | 5 | ||
| Christian Social Party | 374,002 | 6.04 | 3 | 1 | 1 | 5 | ||
| People's Union | 317,830 | 5.13 | 2 | 1 | 0 | 3 | ||
| Vivant | 123,498 | 1.99 | 0 | 0 | 0 | 0 | ||
| National Front | 92,924 | 1.50 | 0 | 0 | 0 | 0 | ||
| Workers' Party of Belgium | 35,493 | 0.57 | 0 | 0 | 0 | 0 | ||
| Party for a New Politics in Belgium | 26,124 | 0.42 | 0 | 0 | 0 | 0 | ||
| New Belgian Front | 23,382 | 0.38 | 0 | 0 | 0 | 0 | ||
| Communist Party | 21,991 | 0.36 | 0 | 0 | 0 | 0 | ||
| Social-Liberal Democrats | 7,446 | 0.12 | 0 | 0 | 0 | 0 | ||
| Democratic Union | 7,368 | 0.12 | 0 | 0 | 0 | 0 | ||
| PJU–PDB | 6,372 | 0.10 | 0 | 0 | 0 | 0 | ||
| VLAAMS | 4,902 | 0.08 | 0 | 0 | 0 | 0 | ||
| Parti Communautaire National-Européen | 3,110 | 0.05 | 0 | 0 | 0 | 0 | ||
| Total | 6,194,371 | 100.00 | 40 | 21 | 10 | 71 | ||
| Valid votes | 6,194,371 | 93.14 | ||||||
| Invalid/blank votes | 456,425 | 6.86 | ||||||
| Total votes | 6,650,796 | 100.00 | ||||||
| Registered voters/turnout | 7,343,466 | 90.57 | ||||||
| Source: Belgian Elections | ||||||||
References
- ^ Carton, Ann (2001). "Open Forum: The General Elections in Belgium in June 1999: A Real Breakthrough for Women Politicians?". European Journal of Women's Studies. 8 (1): 127–135. doi:10.1177/135050680100800107.


