1988 United States presidential election in Rhode Island
| ||||||||||||||||||||||||||
| Turnout | 70.2%[1] | |||||||||||||||||||||||||
|---|---|---|---|---|---|---|---|---|---|---|---|---|---|---|---|---|---|---|---|---|---|---|---|---|---|---|
| ||||||||||||||||||||||||||
| ||||||||||||||||||||||||||
| ||||||||||||||||||||||||||
| Elections in Rhode Island |
|---|
 |
The 1988 United States presidential election in Rhode Island took place on November 8, 1988, as part of the 1988 United States presidential election, which was held throughout all 50 states and D.C. Voters chose four representatives, or electors to the Electoral College, who voted for president and vice president.
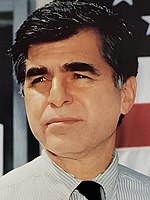
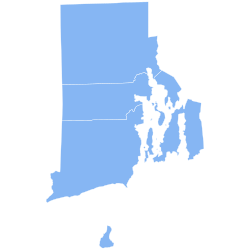
Rhode Island voted for the Democratic nominee, Massachusetts Governor Michael Dukakis, over Republican Vice President George H. W. Bush. Dukakis took 55.64% of the vote to Bush's 43.93%, a margin of 11.71%. This made it one of 10 states (plus the District of Columbia) to vote for Dukakis, while Bush won a convincing electoral victory nationwide.
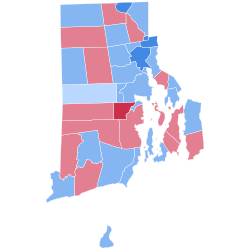
A liberal New England state, Rhode Island gave Dukakis his strongest state victory in the nation, with only the District of Columbia voting more Democratic. It was one of just two states (along with Iowa) to vote Democratic by a double-digit margin, and one of only two states (along with Hawaii) to have all of its counties go to Dukakis. Despite this, it was still a relatively strong Republican performance compared to how the state has trended since. The state has voted Democratic in every presidential election that followed. This is the last time until the 2024 that a Republican candidate won over 40% of the vote in Rhode Island.
To date, this is the last time that the towns of Barrington, Charlestown, Little Compton, Middletown, North Kingstown, and Portsmouth voted Republican.
Results
| 1988 United States presidential election in Rhode Island[2] | |||||
|---|---|---|---|---|---|
| Party | Candidate | Votes | Percentage | Electoral votes | |
| Democratic | Michael Dukakis | 225,123 | 55.64% | 4 | |
| Republican | George H. W. Bush | 177,761 | 43.93% | 0 | |
| Libertarian | Ron Paul | 825 | 0.20% | 0 | |
| New Alliance | Lenora Fulani | 280 | 0.07% | 0 | |
| Peace and Freedom | Herbert G. Lewin | 195 | 0.05% | 0 | |
| America First | David Duke | 159 | 0.04% | 0 | |
| Socialist Workers | James Warren | 130 | 0.03% | 0 | |
| Socialist | Willa Kenoyer | 96 | 0.02% | 0 | |
| Write-ins | Write-ins | 51 | 0.01% | 0 | |
| Totals | 404,620 | 100.00% | 4 | ||
| Voter Turnout (Voting age/Registered) | 53%/74% | ||||
By county
| County | Michael Dukakis Democratic |
George H.W. Bush Republican |
Various candidates Other parties |
Margin | Total votes cast | ||||
|---|---|---|---|---|---|---|---|---|---|
| # | % | # | % | # | % | # | % | ||
| Bristol | 11,168 | 51.04% | 10,626 | 48.56% | 89 | 0.40% | 542 | 2.48% | 21,883 |
| Kent | 37,221 | 51.84% | 34,314 | 47.79% | 266 | 0.37% | 2,907 | 4.05% | 71,801 |
| Newport | 17,597 | 50.76% | 16,923 | 48.82% | 144 | 0.42% | 674 | 1.94% | 34,664 |
| Providence | 135,927 | 58.80% | 94,248 | 40.77% | 984 | 0.43% | 41,679 | 18.03% | 231,159 |
| Washington | 23,210 | 51.51% | 21,650 | 48.04% | 202 | 0.45% | 1,560 | 3.47% | 45,062 |
| Totals | 225,123 | 55.64% | 177,761 | 43.93% | 1,736 | 0.43% | 47,362 | 11.71% | 404,620 |
Counties that flipped from Republican to Democratic
See also
References
- ^ This figure is calculated by dividing the total number of votes cast in 1988 (385,027) by an estimate of the number of registered voters in Rhode Island in 1988 (548,758). See "Voter Turnout, 1988". Rhode Island Board of Elections. Retrieved February 6, 2018.
- ^ "1988 Presidential General Election Results - Rhode Island". Dave Leip's Atlas of U.S. Presidential Elections. Retrieved February 7, 2013.


