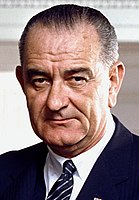
The 1964 United States presidential election in Utah took place on November 3, 1964, as part of the 1964 United States presidential election. State voters chose four[2] representatives, or electors, to the Electoral College, who voted for president and vice president.
Utah was won by incumbent President Lyndon B. Johnson (D–Texas), with 54.86 percent of the popular vote, against Senator Barry Goldwater (R–Arizona), with 45.14 percent of the popular vote.[3][4] As of the 2024 presidential election, this is the last time a Democratic presidential candidate has carried Utah or even exceeded 40% of the state's vote.
As of 2024, it is the last time that Utah County, Weber County, Wasatch County, Duchesne County, Juab County, Morgan County, Beaver County, Wayne County, and Daggett County have voted Democratic, as well as the last time Democrats carried any congressional district in the state.[5]
Results
Results by county
| County
|
Lyndon B. Johnson
Democratic
|
Barry Goldwater
Republican
|
Margin
|
Total votes cast
|
| #
|
%
|
#
|
%
|
#
|
%
|
| Beaver
|
1,189
|
60.02%
|
792
|
39.98%
|
397
|
20.04%
|
1,981
|
| Box Elder
|
5,113
|
42.74%
|
6,851
|
57.26%
|
−1,738
|
−14.52%
|
11,964
|
| Cache
|
6,627
|
41.54%
|
9,326
|
58.46%
|
−2,699
|
−16.92%
|
15,953
|
| Carbon
|
5,672
|
72.70%
|
2,130
|
27.30%
|
3,542
|
45.40%
|
7,802
|
| Daggett
|
170
|
60.28%
|
112
|
39.72%
|
58
|
20.56%
|
282
|
| Davis
|
14,177
|
49.48%
|
14,477
|
50.52%
|
−300
|
−1.04%
|
28,654
|
| Duchesne
|
1,320
|
51.34%
|
1,251
|
48.66%
|
69
|
2.68%
|
2,571
|
| Emery
|
1,434
|
56.52%
|
1,103
|
43.48%
|
331
|
13.04%
|
2,537
|
| Garfield
|
658
|
44.49%
|
821
|
55.51%
|
−163
|
−11.02%
|
1,479
|
| Grand
|
1,145
|
50.33%
|
1,130
|
49.67%
|
15
|
0.66%
|
2,275
|
| Iron
|
2,053
|
44.87%
|
2,522
|
55.13%
|
−469
|
−10.26%
|
4,575
|
| Juab
|
1,319
|
58.75%
|
926
|
41.25%
|
393
|
17.50%
|
2,245
|
| Kane
|
340
|
30.25%
|
784
|
69.75%
|
−444
|
−39.50%
|
1,124
|
| Millard
|
1,462
|
42.56%
|
1,973
|
57.44%
|
−511
|
−14.88%
|
3,435
|
| Morgan
|
835
|
59.35%
|
572
|
40.65%
|
263
|
18.70%
|
1,407
|
| Piute
|
273
|
43.06%
|
361
|
56.94%
|
−88
|
−13.88%
|
634
|
| Rich
|
326
|
42.84%
|
435
|
57.16%
|
−109
|
−14.32%
|
761
|
| Salt Lake
|
103,926
|
57.09%
|
78,118
|
42.91%
|
25,808
|
14.18%
|
182,044
|
| San Juan
|
993
|
42.01%
|
1,371
|
57.99%
|
−378
|
−15.98%
|
2,364
|
| Sanpete
|
2,547
|
49.29%
|
2,620
|
50.71%
|
−73
|
−1.42%
|
5,167
|
| Sevier
|
1,948
|
42.67%
|
2,617
|
57.33%
|
−669
|
−14.66%
|
4,565
|
| Summit
|
1,497
|
52.86%
|
1,335
|
47.14%
|
162
|
5.72%
|
2,832
|
| Tooele
|
5,239
|
67.60%
|
2,511
|
32.40%
|
2,728
|
35.20%
|
7,750
|
| Uintah
|
2,142
|
46.78%
|
2,437
|
53.22%
|
−295
|
−6.44%
|
4,579
|
| Utah
|
23,936
|
53.37%
|
20,912
|
46.63%
|
3,024
|
6.74%
|
44,848
|
| Wasatch
|
1,420
|
55.08%
|
1,158
|
44.92%
|
262
|
10.16%
|
2,578
|
| Washington
|
1,789
|
41.38%
|
2,534
|
58.62%
|
−745
|
−17.24%
|
4,323
|
| Wayne
|
412
|
50.74%
|
400
|
49.26%
|
12
|
1.48%
|
812
|
| Weber
|
29,666
|
59.48%
|
20,206
|
40.52%
|
9,460
|
18.96%
|
49,872
|
| Totals |
219,628 |
54.86% |
180,682 |
45.14% |
38,946 |
9.72% |
400,310
|
Counties that flipped from Republican to Democratic
See also
References


