1936 United States presidential election in New Jersey
| ||||||||||||||||||||||||||
| ||||||||||||||||||||||||||
 County Results
| ||||||||||||||||||||||||||
| ||||||||||||||||||||||||||
| Elections in New Jersey |
|---|
 |
The 1936 United States presidential election in New Jersey took place on November 3, 1936. All contemporary 48 states were part of the 1936 United States presidential election. Voters chose 16 electors to the Electoral College, which selected the president and vice president.
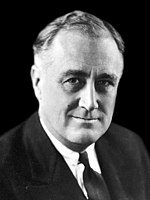
New Jersey was won by the Democratic nominees, incumbent President Franklin D. Roosevelt of New York and his running mate incumbent Vice President John Nance Garner of Texas. Roosevelt and Garner defeated the Republican nominees, Governor Alf Landon of Kansas and his running mate newspaper publisher Frank Knox of Illinois. Roosevelt decisively carried New Jersey with 59.54 percent of the vote to Landon's 39.57 percent, a victory margin of 19.97 percent.[1]
Reflecting the decisiveness of his statewide victory, Roosevelt carried 17 of the New Jersey's 21 counties with majorities of the vote, breaking 60% of the vote in five. This result represented dramatic gains from 1932, when Roosevelt had narrowly carried the state by less than 2 points while winning only four counties in the state. In 1932, Roosevelt had won majorities in populous Middlesex County and rural Warren County, along with a plurality win in Passaic County, but much of Roosevelt's margin of victory was provided by a landslide win in heavily populated Hudson County. Roosevelt had received more than 70% of the vote in Hudson County, part of the New York City metro area.
In 1936, Roosevelt again broke 70% of the vote in Hudson County, but this time thirteen other counties flipped from voting for Herbert Hoover in 1932 to Roosevelt in 1936, enabling him to win the state with a much more comfortable 20 point margin. In North Jersey, Roosevelt won all but two out of the ten northernmost counties. Besides his landslide win in Hudson County, Roosevelt also received more than 60% of the vote in Middlesex and Mercer Counties and won majorities in seven other counties. Landon won only rural Sussex and Morris counties. Roosevelt decisively swept South Jersey, winning majorities in all seven of the southernmost counties in the state. Landon fared better in Central Jersey, where he won Monmouth and Ocean counties.
New Jersey in the early decades of the 20th century had been a reliably Republican state; prior to FDR's 1936 victory, the state had not given a majority of the vote to a Democratic presidential candidate since 1892, with FDR only winning the state with a bare plurality in 1932. However, in 1936, with the emergence of the New Deal Coalition, FDR made dramatic gains for the Democratic Party in New Jersey that would endure and transform it into a closely divided swing state with only a slight Republican lean, a pattern that would endure for much of the 20th century until New Jersey ultimately became a solidly Democratic state in the 1990s. The 1936 election would be the first of many elections to conform to that pattern, with the results making the state about 4 points more Republican than the nation.
Roosevelt was the first Democratic victor in Cumberland County since James Buchanan in 1856, and the first in Essex County since Grover Cleveland in 1892.[2] He was the first to win Hunterdon County since 1916, and the first to win Bergen, Union, Somerset, Mercer, Burlington, Camden, Gloucester, Atlantic, Cape May, and Salem counties since 1912.
Results
| 1936 United States presidential election in New Jersey | |||||
|---|---|---|---|---|---|
| Party | Candidate | Votes | Percentage | Electoral votes | |
| Democratic | Franklin D. Roosevelt (incumbent) | 1,083,850 | 59.54% | 16 | |
| Republican | Alf Landon | 720,322 | 39.57% | 0 | |
| National Union | William Lemke | 9,407 | 0.52% | 0 | |
| Socialist | Norman Thomas | 3,931 | 0.22% | 0 | |
| Communist | Earl Browder | 1,639 | 0.09% | 0 | |
| National Prohibition | D. Leigh Colvin | 926 | 0.05% | 0 | |
| Socialist Labor | John W. Aiken | 362 | 0.02% | 0 | |
| Totals | 1,820,437 | 100.0% | 16 | ||
Results by county
| County | Franklin Delano Roosevelt[3] Democratic |
Alfred Mossman Landon[3] Republican |
William Frederick Lemke[3] National Union |
Norman Mattoon Thomas[3] Socialist |
Various candidates[3] Other parties |
Margin | Total votes cast | ||||||
|---|---|---|---|---|---|---|---|---|---|---|---|---|---|
| # | % | # | % | # | % | # | % | # | % | # | % | ||
| Atlantic | 39,605 | 61.22% | 24,680 | 38.15% | 296 | 0.46% | 47 | 0.07% | 60 | 0.09% | 14,925 | 23.07% | 64,688 |
| Bergen | 91,107 | 50.09% | 89,628 | 49.28% | 530 | 0.29% | 461 | 0.25% | 152 | 0.08% | 1,479 | 0.81% | 181,878 |
| Burlington | 26,095 | 57.78% | 18,644 | 41.29% | 239 | 0.53% | 103 | 0.23% | 78 | 0.17% | 7,451 | 16.50% | 45,159 |
| Camden | 86,300 | 69.74% | 35,874 | 28.99% | 757 | 0.61% | 511 | 0.41% | 300 | 0.24% | 50,426 | 40.75% | 123,742 |
| Cape May | 9,363 | 52.16% | 8,531 | 47.52% | 23 | 0.13% | 16 | 0.09% | 19 | 0.11% | 832 | 4.63% | 17,952 |
| Cumberland | 20,492 | 58.06% | 14,500 | 41.09% | 74 | 0.21% | 63 | 0.18% | 163 | 0.46% | 5,992 | 16.98% | 35,292 |
| Essex | 174,857 | 54.74% | 140,991 | 44.14% | 2,364 | 0.74% | 714 | 0.22% | 515 | 0.16% | 33,866 | 10.60% | 319,441 |
| Gloucester | 20,516 | 56.02% | 15,813 | 43.18% | 88 | 0.24% | 70 | 0.19% | 135 | 0.37% | 4,703 | 12.84% | 36,622 |
| Hudson | 233,390 | 77.65% | 65,110 | 21.66% | 1,259 | 0.42% | 531 | 0.18% | 269 | 0.09% | 168,280 | 55.99% | 300,559 |
| Hunterdon | 9,526 | 51.75% | 8,832 | 47.98% | 1 | 0.01% | 20 | 0.11% | 30 | 0.16% | 694 | 3.77% | 18,409 |
| Mercer | 47,702 | 61.52% | 29,283 | 37.77% | 293 | 0.38% | 151 | 0.19% | 105 | 0.14% | 18,419 | 23.76% | 77,534 |
| Middlesex | 61,679 | 64.69% | 32,959 | 34.57% | 489 | 0.51% | 92 | 0.10% | 121 | 0.13% | 28,720 | 30.12% | 95,340 |
| Monmouth | 38,914 | 48.18% | 41,460 | 51.33% | 228 | 0.28% | 98 | 0.12% | 67 | 0.08% | -2,546 | -3.15% | 80,767 |
| Morris | 24,978 | 43.11% | 32,365 | 55.86% | 300 | 0.52% | 211 | 0.36% | 89 | 0.15% | -7,387 | -12.75% | 57,943 |
| Ocean | 9,889 | 46.27% | 11,293 | 52.84% | 117 | 0.55% | 31 | 0.15% | 42 | 0.20% | -1,404 | -6.57% | 21,372 |
| Passaic | 71,384 | 58.42% | 49,046 | 40.14% | 1,113 | 0.91% | 308 | 0.25% | 339 | 0.28% | 22,338 | 18.28% | 122,190 |
| Salem | 11,614 | 59.86% | 7,671 | 39.54% | 31 | 0.16% | 36 | 0.19% | 50 | 0.26% | 3,943 | 20.32% | 19,402 |
| Somerset | 15,987 | 50.14% | 15,806 | 49.57% | 15 | 0.05% | 35 | 0.11% | 44 | 0.14% | 181 | 0.57% | 31,887 |
| Sussex | 6,862 | 46.17% | 7,945 | 53.46% | 25 | 0.17% | 10 | 0.07% | 19 | 0.13% | -1,083 | -7.29% | 14,861 |
| Union | 70,813 | 53.61% | 59,553 | 45.08% | 1,162 | 0.88% | 363 | 0.27% | 206 | 0.16% | 11,260 | 8.52% | 132,097 |
| Warren | 12,476 | 56.82% | 9,437 | 42.98% | 1 | 0.00% | 24 | 0.11% | 19 | 0.09% | 3,039 | 13.84% | 21,957 |
| Totals | 1,083,549 | 59.56% | 719,421 | 39.55% | 9,405 | 0.52% | 3,895 | 0.21% | 2,852 | 0.16% | 364,128 | 20.02% | 1,819,122 |
Counties that flipped from Republican to Democratic
- Cape May
- Cumberland
- Atlantic
- Salem
- Gloucester
- Camden
- Burlington
- Mercer
- Hunterdon
- Essex
- Bergen
- Somerset
- Union
See also
References
- ^ "1936 Presidential General Election Results – New Jersey". Dave Leip's Atlas of U.S. Presidential Elections. Retrieved December 1, 2013.
- ^ Menendez, Albert J.; The Geography of Presidential Elections in the United States, 1868-2004, pp. 258-259 ISBN 0786422173
- ^ a b c d e Our Campaigns; NJ US President Race, November 03, 1936


