1920 United States presidential election in New Jersey
| ||||||||||||||||||||||||||
| ||||||||||||||||||||||||||
 County Results
Harding 50-60% 60-70% 70-80%
| ||||||||||||||||||||||||||
| ||||||||||||||||||||||||||
| Elections in New Jersey |
|---|
 |
The 1920 United States presidential election in New Jersey took place on November 2, 1920. All contemporary 48 states were part of the 1920 United States presidential election. Voters chose 14 electors to the Electoral College, which selected the president and vice president.
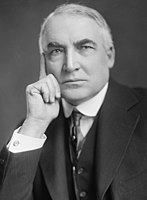
New Jersey was won in a landslide by the Republican nominees, Senator Warren G. Harding of Ohio and his running mate Governor Calvin Coolidge of Massachusetts. Harding and Coolidge defeated the Democratic nominees, Governor James M. Cox of Ohio and his running mate Assistant Secretary of the Navy Franklin D. Roosevelt of New York. Also running that year was Socialist candidate Eugene V. Debs of Indiana and his running mate Seymour Stedman of Illinois.
Harding carried New Jersey overwhelmingly with 67.65 percent of the vote to Cox's 28.42 percent, a victory margin of 39.23%.[1] This is the highest popular vote percentage ever recorded by any candidate in New Jersey.[2] On the county level map, reflecting the decisiveness of his victory, Harding became the first presidential nominee to sweep all 21 of New Jersey's counties, a feat later accomplished only by Dwight D. Eisenhower in 1956, Lyndon B. Johnson in 1964 and Richard Nixon in 1972.[2]
He was the first Republican to ever carry Warren County and Hunterdon County and only the second after William McKinley in 1896 to carry Sussex County,[3] which had been historically hostile to Yankee New England and Democratic ever since the Second Party System.[4] Harding broke sixty percent of the vote in seventeen counties and seventy percent in nine of those.
Debs finished in a distant but fairly solid, for a third-party candidate, third with 3.00 percent.
Like much of the Northeast, New Jersey in this era was a staunchly Republican state, having not given a majority of the vote to a Democratic presidential candidate since 1892. With the deeply unpopular Democratic administration of Woodrow Wilson as the backdrop for the 1920 campaign, Warren G. Harding promised a "return to normalcy" that appealed to many voters, while Cox was tied to the policies of the Wilson administration. Harding won nationally in one of the most decisive landslides in American history, and New Jersey, already a fiercely Republican state, went even harder for Harding than the nation, making New Jersey a solid 13 points more Republican than the national average.
As of 2020, this remains the strongest ever performance by any presidential candidate in New Jersey; no candidate has ever exceeded Harding's share of the popular vote or his margin of victory. The elections of 1920 and 1924 would prove to be the Republican Party's high mark in the state of New Jersey, the culmination of an era of Republican dominance in the state beginning in 1896. By 1928, the state would begin trending Democratic when the Democratic Party nominated Al Smith, a New York City native and Roman Catholic of Irish, Italian and German immigrant heritage who appealed greatly to urban New Jersey voters, and beginning in 1932, the state would vote Democratic in all four of Democrat Franklin Roosevelt's elections with the rise of the New Deal Coalition.
Results
| 1920 United States presidential election in New Jersey | |||||
|---|---|---|---|---|---|
| Party | Candidate | Votes | Percentage | Electoral votes | |
| Republican | Warren G. Harding | 611,541 | 67.65% | 14 | |
| Democratic | James M. Cox | 256,887 | 28.42% | 0 | |
| Socialist | Eugene V. Debs | 27,141 | 3.00% | 0 | |
| National Prohibition | Aaron S. Watkins | 4,734 | 0.52% | 0 | |
| Farmer-Labor | Parley P. Christensen | 2,200 | 0.24% | 0 | |
| Socialist Labor | William Wesley Cox | 923 | 0.10% | 0 | |
| Single Tax | Robert Macauley | 517 | 0.06% | 0 | |
| Totals | 903,943 | 100.0% | 14 | ||
Results by county
| County | Warren Gamaliel Harding Republican |
James Middleton Cox Democratic |
Eugene Victor Debs Socialist |
Aaron Sherman Watkins National Prohibition |
Various candidates Other parties |
Margin | Total votes cast[5][a] | ||||||
|---|---|---|---|---|---|---|---|---|---|---|---|---|---|
| # | % | # | % | # | % | # | % | # | % | # | % | ||
| Atlantic | 21,245 | 76.63% | 5,753 | 20.75% | 390 | 1.41% | 287 | 1.04% | 50 | 0.18% | 15,492 | 55.88% | 27,725 |
| Bergen | 47,512 | 76.26% | 12,396 | 19.90% | 1,849 | 2.97% | 155 | 0.25% | 393 | 0.63% | 35,116 | 56.36% | 62,305 |
| Burlington | 17,898 | 68.73% | 7,532 | 28.92% | 229 | 0.88% | 318 | 1.22% | 64 | 0.25% | 10,366 | 39.81% | 26,041 |
| Camden | 40,771 | 65.67% | 17,893 | 28.82% | 2,467 | 3.97% | 725 | 1.17% | 231 | 0.37% | 22,878 | 36.85% | 62,087 |
| Cape May | 5,785 | 70.76% | 2,198 | 26.89% | 107 | 1.31% | 77 | 0.94% | 8 | 0.10% | 3,587 | 43.88% | 8,175 |
| Cumberland | 11,913 | 68.36% | 4,487 | 25.75% | 473 | 2.71% | 501 | 2.87% | 53 | 0.30% | 7,426 | 42.61% | 17,427 |
| Essex | 116,168 | 70.90% | 40,970 | 25.00% | 5,939 | 3.62% | 176 | 0.11% | 595 | 0.36% | 75,198 | 45.89% | 163,848 |
| Gloucester | 11,693 | 66.60% | 4,869 | 27.73% | 225 | 1.28% | 752 | 4.28% | 18 | 0.10% | 6,824 | 38.87% | 17,557 |
| Hudson | 101,759 | 59.58% | 62,637 | 36.67% | 5,454 | 3.19% | 34 | 0.02% | 909 | 0.53% | 39,122 | 22.91% | 170,793 |
| Hunterdon | 7,443 | 54.38% | 6,067 | 44.33% | 76 | 0.56% | 80 | 0.58% | 20 | 0.15% | 1,376 | 10.05% | 13,686 |
| Mercer | 29,626 | 63.46% | 15,713 | 33.66% | 1,169 | 2.50% | 69 | 0.15% | 106 | 0.23% | 13,913 | 29.80% | 46,683 |
| Middlesex | 29,334 | 69.70% | 11,618 | 27.60% | 848 | 2.01% | 139 | 0.33% | 149 | 0.35% | 17,716 | 42.09% | 42,088 |
| Monmouth | 28,818 | 68.07% | 12,975 | 30.65% | 291 | 0.69% | 162 | 0.38% | 90 | 0.21% | 15,843 | 37.42% | 42,336 |
| Morris | 20,686 | 71.50% | 7,256 | 25.08% | 578 | 2.00% | 284 | 0.98% | 127 | 0.44% | 13,430 | 46.42% | 28,931 |
| Ocean | 6,840 | 74.84% | 2,138 | 23.39% | 96 | 1.05% | 53 | 0.58% | 12 | 0.13% | 4,702 | 51.45% | 9,139 |
| Passaic | 42,692 | 72.08% | 11,873 | 20.05% | 4,153 | 7.01% | 108 | 0.18% | 399 | 0.67% | 30,819 | 52.04% | 59,225 |
| Salem | 7,638 | 66.50% | 3,483 | 30.33% | 98 | 0.85% | 253 | 2.20% | 13 | 0.11% | 4,155 | 36.18% | 11,485 |
| Somerset | 10,962 | 71.02% | 4,192 | 27.16% | 163 | 1.06% | 80 | 0.52% | 38 | 0.25% | 6,770 | 43.86% | 15,435 |
| Sussex | 5,224 | 58.75% | 3,516 | 39.54% | 42 | 0.47% | 97 | 1.09% | 13 | 0.15% | 1,708 | 19.21% | 8,892 |
| Union | 39,409 | 72.57% | 12,103 | 22.29% | 2,353 | 4.33% | 122 | 0.22% | 316 | 0.58% | 27,306 | 50.28% | 54,303 |
| Warren | 8,035 | 51.23% | 7,218 | 46.02% | 192 | 1.22% | 202 | 1.29% | 36 | 0.23% | 817 | 5.21% | 15,683 |
| Totals | 611,451[b] | 67.65% | 256,887 | 28.42% | 27,192[b] | 3.01% | 4,674[b] | 0.52% | 3,640 | 0.40% | 354,564 | 39.23% | 903,844 |
See also
- Presidency of Warren G. Harding
- Presidency of Calvin Coolidge
- United States presidential elections in New Jersey
Notes
References
- ^ "1920 Presidential General Election Results - New Jersey". Dave Leip's Atlas of U.S. Presidential Elections. Retrieved February 5, 2014.
- ^ a b Thomas, G. Scott; The Pursuit of the White House: A Handbook of Presidential Election Statistics and History, pp. 439-440 ISBN 0313257957
- ^ Menendez, Albert J.; The Geography of Presidential Elections in the United States, 1868-2004, pp. 258-259 ISBN 0786422173
- ^ Phillips, Kevin P.; The Emerging Republican Majority, pp. 121-134 ISBN 978-0-691-16324-6
- ^ New Jersey Department of Law and Public Safety Division of Elections; Manual of the Legislature of New Jersey 1921 – Average President and Vice-President Electoral Vote – November 2, 1920


