Suplac
Suplac Küküllőszéplak | |
|---|---|
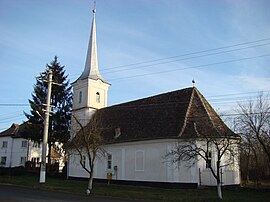
 Reformed church in Suplac | |
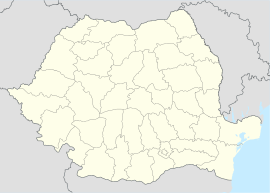
 Location in Mureș County | |
| Coordinates: 46°23′N 24°31′E / 46.383°N 24.517°E | |
| Country | Romania |
| County | Mureș |
| Government | |
| • Mayor (2020–2024) | Béla Szakács[1] (UDMR) |
Area | 45.72 km2 (17.65 sq mi) |
| Elevation | 306 m (1,004 ft) |
| Population (2021-12-01)[2] | 2,047 |
| • Density | 45/km2 (120/sq mi) |
| Time zone | EET/EEST (UTC+2/+3) |
| Postal code | 547580 |
| Area code | (+40) 0265 |
| Vehicle reg. | MS |
| Website | primariasuplac |
Suplac (Hungarian: Küküllőszéplak; Hungarian pronunciation: [ˈkykylːøːseːplɒk], meaning "nice place on the river Küküllő") is a commune in Mureș County, Transylvania, Romania which is composed of five villages: Idrifaia (Héderfája), Laslău Mare (Oláhszentlászló), Laslău Mic (Kisszentlászló), Suplac, and Vaidacuta (Vajdakuta).
History
The locality formed part of the Székely Land region of the historical Transylvania province. Until 1918, the villages belonged to the Maros-Torda County of the Kingdom of Hungary. In the immediate aftermath of World War I, following the declaration of the Union of Transylvania with Romania, the area passed under Romanian administration during the Hungarian–Romanian War of 1918–1919. By the terms of the Treaty of Trianon of 1920, Suplac became part of the Kingdom of Romania.
Economy
The Laslău Mare gas field is located in the village of Laslău Mare. It was established in 1925 and was still operational as of 2010. The estimated reserves have been quantified as 5×10⁹ m3 (1.8×10¹¹ cu ft).
Demographics
| Year | Pop. | ±% |
|---|---|---|
| 1850 | 3,260 | — |
| 1941 | 4,135 | +26.8% |
| 1977 | 3,420 | −17.3% |
| 1992 | 2,548 | −25.5% |
| 2002 | 2,369 | −7.0% |
| 2011 | 2,249 | −5.1% |
| 2021 | 2,047 | −9.0% |
| Source: Census data | ||
According to the 2011 census, the commune had a population of 2,249, of which 50.51% were Hungarians, 34.82% were Romanians, and 11.69% were Roma. At the 2021 census, Suplac had 2,047 inhabitants; of those, 49.88% were Hungarians, 34.64% Romanians, and 10.21% Roma.[3]
See also
References
- ^ "Results of the 2020 local elections". Central Electoral Bureau. Retrieved 11 June 2021.
- ^ "Populaţia rezidentă după grupa de vârstă, pe județe și municipii, orașe, comune, la 1 decembrie 2021" (XLS). National Institute of Statistics.
- ^ "Populația rezidentă după grupa de vârstă, pe județe și municipii, orașe, comune, la 1 decembrie 2021" (in Romanian). INSSE. 31 May 2023.


