San Sebastián de La Gomera
San Sebastián de La Gomera | |
|---|---|
Municipality | |
 San Sebastián de La Gomera | |
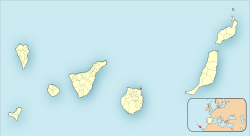
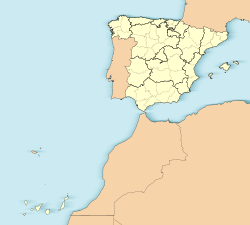
 Location of Las San Sebastián de La Gomera | |
| Coordinates: 28°5′32″N 17°6′36″W / 28.09222°N 17.11000°W | |
| Country | |
| Autonomous Community | |
| Province | Santa Cruz de Tenerife |
| Island | La Gomera |
| Government | |
| • Mayor | Adasat Reyes Herrera (Agrupación Socialista Gomera (ASG)) |
| Area | |
• Total | 113.59 km2 (43.86 sq mi) |
| Population (1 January 2023)[2] | |
• Total | 9,584 |
| • Density | 84/km2 (220/sq mi) |
| Time zone | UTC+0 (CET) |
| • Summer (DST) | UTC+1 (CEST (GMT +1)) |
| Postal code | 38880 |
| Area code | +34 (Spain) + 922 (Tenerife) |
| Website | Town Hall |
San Sebastián de La Gomera is the capital and a municipality of La Gomera in the Canary Islands, Spain. It also hosts the main harbour. The population was 9,584 in 2023,[3] and the area is 113.59 square kilometres (43.86 sq mi).[1]
The port serves ferry routes to the islands of Tenerife, La Palma and El Hierro. Streets include Calle Real and F. Olsen. A bus station named Estación de Guaguas is used for bus lines throughout the island; it is located on Avenida Del Quinto Centenario.
History
On 6 September, 1492, Christopher Columbus, having restocked his provisions and made repairs, departed from San Sebastián de La Gomera on his first expedition to what he thought were the Indies not knowing that the Americas were what he eventually discovered.[4]
List of notable people
- Ignacio Lorenzo de Armas (born 1706), settler and mayor of San Antonio, Texas in 1738 and 1764.
Gallery
- San Sebastián de La Gomera
- Torre del conde
- Church Iglesia de La Asunción
- The big Fred. Olsen Express ferry
- Old and new in San Sebastian
- Old windmill in San Sebastian
Geography and climate
San Sebastián de La Gomera has a hot desert climate (Köppen: BWh; Trewartha: BWal) with an annual precipitation of only 146.8 millimetres (5.78 in) and no more than 18 days of precipitation.
| Climate data for San Sebastián de La Gomera WMO ID: 60008; Climate ID: C329Z; coordinates 28°05′23″N 17°06′41″W / 28.08972°N 17.11139°W; elevation: 15 m (49 ft); 1991–2020 normals, extremes 1989–present[5] | |||||||||||||
|---|---|---|---|---|---|---|---|---|---|---|---|---|---|
| Month | Jan | Feb | Mar | Apr | May | Jun | Jul | Aug | Sep | Oct | Nov | Dec | Year |
| Record high °C (°F) | 27.1 (80.8) |
30.8 (87.4) |
34.9 (94.8) |
33.4 (92.1) |
38.6 (101.5) |
36.1 (97.0) |
38.9 (102.0) |
41.9 (107.4) |
37.4 (99.3) |
36.2 (97.2) |
33.7 (92.7) |
29.0 (84.2) |
41.9 (107.4) |
| Mean maximum °C (°F) | 24.9 (76.8) |
24.9 (76.8) |
26.8 (80.2) |
25.5 (77.9) |
27.9 (82.2) |
30.7 (87.3) |
33.5 (92.3) |
33.9 (93.0) |
30.9 (87.6) |
31.1 (88.0) |
28.3 (82.9) |
25.9 (78.6) |
36.4 (97.5) |
| Mean daily maximum °C (°F) | 21.6 (70.9) |
21.4 (70.5) |
22.0 (71.6) |
22.3 (72.1) |
23.3 (73.9) |
25.2 (77.4) |
26.8 (80.2) |
27.9 (82.2) |
27.4 (81.3) |
26.5 (79.7) |
24.6 (76.3) |
22.8 (73.0) |
24.3 (75.7) |
| Daily mean °C (°F) | 18.9 (66.0) |
18.8 (65.8) |
19.4 (66.9) |
19.8 (67.6) |
21.0 (69.8) |
22.8 (73.0) |
24.4 (75.9) |
25.3 (77.5) |
25.0 (77.0) |
24.0 (75.2) |
22.1 (71.8) |
20.1 (68.2) |
21.8 (71.2) |
| Mean daily minimum °C (°F) | 16.2 (61.2) |
16.3 (61.3) |
16.7 (62.1) |
17.3 (63.1) |
18.6 (65.5) |
20.3 (68.5) |
21.8 (71.2) |
22.7 (72.9) |
22.6 (72.7) |
21.4 (70.5) |
19.5 (67.1) |
17.4 (63.3) |
19.2 (66.6) |
| Mean minimum °C (°F) | 13.7 (56.7) |
13.6 (56.5) |
13.9 (57.0) |
15.1 (59.2) |
16.5 (61.7) |
18.4 (65.1) |
20.4 (68.7) |
21.1 (70.0) |
20.5 (68.9) |
18.8 (65.8) |
16.7 (62.1) |
14.8 (58.6) |
12.8 (55.0) |
| Record low °C (°F) | 11.4 (52.5) |
11.9 (53.4) |
11.2 (52.2) |
13.0 (55.4) |
14.5 (58.1) |
17.0 (62.6) |
18.6 (65.5) |
18.4 (65.1) |
19.3 (66.7) |
15.5 (59.9) |
11.8 (53.2) |
13.2 (55.8) |
11.2 (52.2) |
| Average precipitation mm (inches) | 10.2 (0.40) |
22.1 (0.87) |
12.3 (0.48) |
8.9 (0.35) |
1.1 (0.04) |
0.5 (0.02) |
0.4 (0.02) |
2.1 (0.08) |
2.2 (0.09) |
19.2 (0.76) |
35.0 (1.38) |
32.9 (1.30) |
146.8 (5.78) |
| Average precipitation days (≥ 1.0 mm) | 1.9 | 2.9 | 1.8 | 1.4 | 0.3 | 0.1 | 0.1 | 0.5 | 0.6 | 2.1 | 2.5 | 3.1 | 17.2 |
| Average relative humidity (%) | 67 | 68 | 69 | 70 | 71 | 71 | 70 | 71 | 73 | 73 | 70 | 69 | 70 |
| Source: State Meteorological Agency/AEMET OpenData[6][7][8] | |||||||||||||
See also
References
- ^ a b Instituto Canario de Estadística, area
- ^ Estimate of 1 January 2023: from Instituto Nacional de Estadística, Madrid.
- ^ Estimate of 1 January 2023: from Instituto Nacional de Estadística, Madrid.
- ^ Phillips & Phillips 1992, pp. 146–47.
- ^ "Weather station data". opendata.aemet.es (in Spanish). AEMET OpenData. Archived from the original on 2024-11-13. Retrieved 13 November 2024.
- ^ "Extremes". opendata.aemet.es (in Spanish). AEMET OpenData. Archived from the original on 2025-01-07. Retrieved 9 January 2025.
- ^ "Normal". opendata.aemet.es (in Spanish). AEMET OpenData. Archived from the original on 2025-01-09. Retrieved 9 January 2025.
- ^ "AEMET OpeenData". Agencia Estatal de Meteorologia. Retrieved 2024-11-13.
Bibliography
- Phillips, William D. Jr.; Phillips, Carla Rahn (1992). The Worlds of Christopher Columbus. Cambridge, UK: Cambridge University Press. ISBN 978-0-521-35097-6.


