Le Palais
Le Palais Porzh-Lae | |
|---|---|
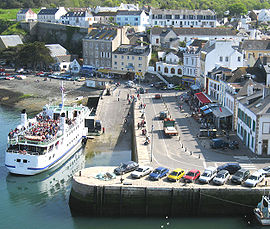
 Ferry in the harbour | |
| Coordinates: 47°20′50″N 3°09′15″W / 47.3472°N 3.1542°W | |
| Country | France |
| Region | Brittany |
| Department | Morbihan |
| Arrondissement | Lorient |
| Canton | Quiberon |
| Intercommunality | Belle-Île-en-Mer |
| Government | |
| • Mayor (2020–2026) | Tibault Grollemund[1] |
Area 1 | 17.43 km2 (6.73 sq mi) |
| Population (2022)[2] | 2,576 |
| • Density | 150/km2 (380/sq mi) |
| Time zone | UTC+01:00 (CET) |
| • Summer (DST) | UTC+02:00 (CEST) |
| INSEE/Postal code | 56152 /56360 |
| Elevation | 0–58 m (0–190 ft) |
| 1 French Land Register data, which excludes lakes, ponds, glaciers > 1 km2 (0.386 sq mi or 247 acres) and river estuaries. | |
Le Palais (French pronunciation: [lə palɛ]; Breton: Porzh-Lae) is a commune in the Morbihan department of Brittany in northwestern France.[3] It is one of the four communes on the island of Belle Île.
Geography
Le Palais is one of the four communes of Belle île en Mer. It is the most populated. It houses the administrative center and the main port of the island. The town centre is located 4.5 km (2.8 mi) northeast of Bangor, 5.8 km (3.6 mi) southeast of Sauzon and 8 km (5.0 mi) northwest of Locmaria.
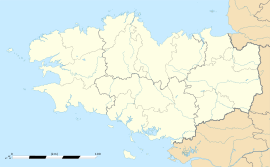
Map
Population
Inhabitants of Le Palais are called in French Palantins. Le Palais's population peaked in 1872.
|
| ||||||||||||||||||||||||||||||||||||||||||||||||||||||||||||||||||||||||||||||||||||||||||||||||||||||||||||||||||
| Source: EHESS[4] and INSEE (1968-2020)[5] | |||||||||||||||||||||||||||||||||||||||||||||||||||||||||||||||||||||||||||||||||||||||||||||||||||||||||||||||||||
See also
References
- ^ "Maires du Morbihan" (PDF). Préfecture du Morbihan. 7 July 2020.
- ^ "Populations de référence 2022" (in French). The National Institute of Statistics and Economic Studies. 19 December 2024.
- ^ INSEE commune file
- ^ Des villages de Cassini aux communes d'aujourd'hui: Commune data sheet Le Palais, EHESS (in French).
- ^ Population en historique depuis 1968, INSEE
External links
- Base Mérimée: Search for heritage in the commune, Ministère français de la Culture. (in French)
- Mayors of Morbihan Association (in French)


