Flovilla, Georgia
Flovilla, Georgia | |
|---|---|
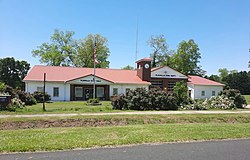
 Flovilla City Hall | |
 Location in Butts County and the state of Georgia | |
| Coordinates: 33°15′20″N 83°53′54″W / 33.25556°N 83.89833°W | |
| Country | United States |
| State | Georgia |
| County | Butts |
| Area | |
• Total | 1.96 sq mi (5.07 km2) |
| • Land | 1.96 sq mi (5.07 km2) |
| • Water | 0.00 sq mi (0.00 km2) |
| Elevation | 541 ft (165 m) |
| Population (2020) | |
• Total | 643 |
| • Density | 328.40/sq mi (126.80/km2) |
| Time zone | UTC-5 (Eastern (EST)) |
| • Summer (DST) | UTC-4 (EDT) |
| ZIP code | 30216 |
| Area code | 770 |
| FIPS code | 13-30312[2] |
| GNIS feature ID | 0355853[3] |
| Website | cityofflovilla |
Flovilla is a city in Butts County, Georgia, United States. The population was 653 at the 2010 census,[4] and 643 in 2020.
Indian Springs State Park is nearby.
History
Flovilla incorporated in 1885.[5] Flovilla is a coined name meaning "village of flowers".[6]
Geography
Flovilla is located in southeastern Butts County at 33°15′20″N 83°53′54″W / 33.255441°N 83.898218°W.[7] U.S. Route 23 passes through the center of the city, leading northwest 5 miles (8 km) to Jackson, the county seat, and southeast 34 miles (55 km) to Macon. Indian Springs State Park is located 2 miles (3 km) west of the city along Georgia State Route 42 and contains a lake, a campground, and the springs for which it is named.
According to the United States Census Bureau, the city has a total area of 2.0 square miles (5.1 km2), all land.[4]
Demographics
| Census | Pop. | Note | %± |
|---|---|---|---|
| 1890 | 422 | — | |
| 1900 | 523 | 23.9% | |
| 1910 | 495 | −5.4% | |
| 1920 | 371 | −25.1% | |
| 1930 | 230 | −38.0% | |
| 1940 | 240 | 4.3% | |
| 1950 | 315 | 31.3% | |
| 1960 | 284 | −9.8% | |
| 1970 | 289 | 1.8% | |
| 1980 | 458 | 58.5% | |
| 1990 | 602 | 31.4% | |
| 2000 | 652 | 8.3% | |
| 2010 | 653 | 0.2% | |
| 2020 | 643 | −1.5% | |
| U.S. Decennial Census[8] | |||
| Race / Ethnicity | Pop 2010[9] | Pop 2020[10] | % 2010 | % 2020 |
|---|---|---|---|---|
| White alone (NH) | 322 | 328 | 49.31% | 51.01% |
| Black or African American alone (NH) | 316 | 270 | 48.39% | 41.99% |
| Native American or Alaska Native alone (NH) | 0 | 0 | 0.00% | 0.00% |
| Asian alone (NH) | 2 | 3 | 0.31% | 0.47% |
| Pacific Islander alone (NH) | 0 | 0 | 0.00% | 0.00% |
| Some Other Race alone (NH) | 0 | 3 | 0.00% | 0.47% |
| Mixed Race/Multi-Racial (NH) | 4 | 25 | 0.61% | 3.89% |
| Hispanic or Latino (any race) | 9 | 14 | 1.38% | 2.18% |
| Total | 653 | 643 | 100.00% | 100.00% |
In 2010, the city had a population of 653, before declining to 643 at the 2020 census.[9][10]
References
- ^ "2020 U.S. Gazetteer Files". United States Census Bureau. Retrieved December 18, 2021.
- ^ "U.S. Census website". United States Census Bureau. Retrieved January 31, 2008.
- ^ "US Board on Geographic Names". United States Geological Survey. October 25, 2007. Retrieved January 31, 2008.
- ^ a b "Geographic Identifiers: 2010 Demographic Profile Data (G001): Flovilla city, Georgia". U.S. Census Bureau, American Factfinder. Archived from the original on February 12, 2020. Retrieved November 8, 2013.
- ^ "Flovilla". GeorgiaGov. Archived from the original on January 11, 2019. Retrieved May 24, 2018.
- ^ "City History". City of Flovilla. Archived from the original on September 9, 2022. Retrieved May 24, 2018.
- ^ "US Gazetteer files: 2010, 2000, and 1990". United States Census Bureau. February 12, 2011. Retrieved April 23, 2011.
- ^ "Census of Population and Housing". Census.gov. Retrieved June 4, 2015.
- ^ a b "P2 HISPANIC OR LATINO, AND NOT HISPANIC OR LATINO BY RACE – 2010: DEC Redistricting Data (PL 94-171) – Flovilla city, Georgia". United States Census Bureau.
- ^ a b "P2 HISPANIC OR LATINO, AND NOT HISPANIC OR LATINO BY RACE - 2020: DEC Redistricting Data (PL 94-171) - Flovilla city, Georgia". United States Census Bureau.

