
File:Wiggers Diagram 2.svg

Original file (SVG file, nominally 1,098 × 841 pixels, file size: 14 KB)
Summary
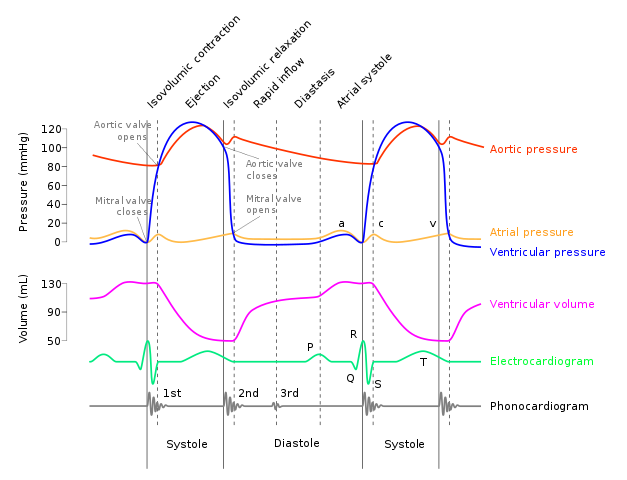
| Description | English: A Wiggers diagram, showing the cardiac cycle events occuring in the left ventricle.
In the atrial pressure plot: wave "a" corresponds to atrial contraction, wave "c" corresponds to an increase in pressure from the mitral valve bulging into the atrium after closure, and wave "v" corresponds to passive atrial filling. In the electrocardiogram: wave "P" corresponds to atrial depolarization, waves "QRS" correspond to ventricular depolarization, and wave "T" corresponds to ventricular repolarization. In the phonocardiogram: The sound labeled 1st contributes to the S1 heart sound and is the reverberation of blood from the sudden closure of the mitral valve (left A-V valve) and the sound labeled "2nd" contributes to the S2 heart sound and is the reverberation of blood from the sudden closure of the aortic valve. |
| Date | |
| Source | Wikimedia Commons: Wiggers Diagram.svg |
| Author | adh30 revised work by DanielChangMD who revised original work of DestinyQx; Redrawn as SVG by xavax |
| Other versions |
SVG
PNG
|


This image was updated to extend the range of colors and to correct an error in the original - aortic pressure now correctly exceeds left ventricular pressure in the end-systolic period (e.g. see Sugawara M, Uchida K, Kondoh Y, et al. Aortic blood momentum--the more the better for the ejecting heart in vivo? Cardiovasc Res 1997; 33(2): 433--46). .
Licensing
- You are free:
- to share – to copy, distribute and transmit the work
- to remix – to adapt the work
- Under the following conditions:
- attribution – You must give appropriate credit, provide a link to the license, and indicate if changes were made. You may do so in any reasonable manner, but not in any way that suggests the licensor endorses you or your use.
- share alike – If you remix, transform, or build upon the material, you must distribute your contributions under the same or compatible license as the original.
File history
Click on a date/time to view the file as it appeared at that time.
| Date/Time | Thumbnail | Dimensions | User | Comment | |
|---|---|---|---|---|---|
| current | 18:34, 24 July 2016 | | 1,098 × 841 (14 KB) | Adh30 | User created page with UploadWizard |
File usage
The following 3 pages use this file:
Global file usage
The following other wikis use this file:
- Usage on bs.wikipedia.org
- Usage on hy.wikipedia.org