1976 United States presidential election in New Hampshire
| ||||||||||||||||||||||||||
| ||||||||||||||||||||||||||
| ||||||||||||||||||||||||||
| ||||||||||||||||||||||||||
| Elections in New Hampshire |
|---|
 |
The 1976 United States presidential election in New Hampshire took place on November 2, 1976, as part of the 1976 United States presidential election, which was held throughout all 50 states and D.C. Voters chose four representatives, or electors to the Electoral College, who voted for president and vice president.
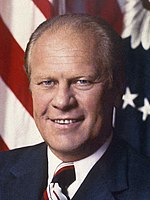
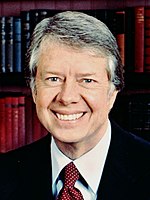
New Hampshire was won by the Republican nominees, incumbent President Gerald Ford of Michigan and his running mate Senator Bob Dole of Kansas. Ford and Dole defeated the Democratic nominees, Governor Jimmy Carter of Georgia and his running mate Senator Walter Mondale of Minnesota.
Ford took 54.75% of the vote to Carter's 43.47%, a margin of 11.28%. Anti-war former Democratic Senator Eugene McCarthy of Minnesota, running as an Independent presidential candidate, came in a distant third, with 1.21%. New Hampshire in this era normally leaned Republican, having not gone Democratic since the nationwide Democratic landslide of 1964. The Northern moderate Republican Ford easily triumphed in New Hampshire over the Southern Democrat Jimmy Carter.
On the county map, Ford won nine of New Hampshire's ten counties, with only rural Coos County in the far north of the state giving a 51-49 majority to Carter. In a sign of the state's Republican trend that would occur in the 1970s and 1980s, even while narrowly losing the national race, Ford won two of the state's traditional New Deal Democratic counties, with a majority win in Hillsborough County and a plurality win in Strafford County. Since 1932, both of these counties, along with Coos County, had gone Democratic in every close presidential election or Democratic victory, voting every time for Franklin D. Roosevelt, Harry S. Truman, John F. Kennedy, Lyndon B. Johnson, and Hubert H. Humphrey. Carter became the first Democrat to win the White House without carrying Hillsborough County and Strafford County since Grover Cleveland in 1892.
Ford's decisive victory in New Hampshire, while narrowly losing the national race, would make the state over 13% more Republican than the national average in the 1976 election. As of the 2020 presidential election, this is the most last presidential election that a Democrat would win a presidential election without carrying New Hampshire, and the last presidential election until 2016 when the winner of Coös County did not also carry the state as well. The state would not vote for a losing candidate again until 2004.
Results
| 1976 United States presidential election in New Hampshire[1] | |||||
|---|---|---|---|---|---|
| Party | Candidate | Votes | Percentage | Electoral votes | |
| Republican | Gerald Ford (incumbent) | 185,935 | 54.75% | 4 | |
| Democratic | Jimmy Carter | 147,635 | 43.47% | 0 | |
| McCarthy '76 | Eugene McCarthy | 4,095 | 1.21% | 0 | |
| Libertarian | Roger MacBride | 936 | 0.28% | 0 | |
| Write-ins | Write-ins | 604 | 0.18% | 0 | |
| U.S. Labor | Lyndon LaRouche | 186 | 0.05% | 0 | |
| Socialist Workers | Peter Camejo | 161 | 0.05% | 0 | |
| Socialist Labor | Julius Levin | 66 | 0.02% | 0 | |
| Totals | 339,618 | 100.00% | 4 | ||
| Voter Turnout (Voting age/Registered) | 57%/71% | ||||
Results by county
| County[2] | Gerald Ford Republican |
Jimmy Carter Democratic |
Eugene McCarthy McCarthy ‘76 |
Various candidates Other parties |
Margin | Total votes cast | |||||
|---|---|---|---|---|---|---|---|---|---|---|---|
| # | % | # | % | # | % | # | % | # | % | ||
| Belknap | 9,876 | 60.78% | 6,143 | 37.81% | 120 | 0.74% | 110 | 0.68% | 3,733 | 22.97% | 16,249 |
| Carroll | 8,561 | 70.18% | 3,374 | 27.66% | 169 | 1.39% | 94 | 0.77% | 5,187 | 42.52% | 12,198 |
| Cheshire | 12,554 | 53.87% | 10,388 | 44.57% | 260 | 1.12% | 103 | 0.44% | 2,166 | 9.30% | 23,305 |
| Coös | 7,094 | 48.46% | 7,385 | 50.45% | 92 | 0.63% | 67 | 0.46% | -291 | -1.99% | 14,638 |
| Grafton | 14,430 | 60.34% | 8,996 | 37.62% | 369 | 1.54% | 119 | 0.50% | 5,434 | 22.72% | 23,914 |
| Hillsborough | 53,581 | 53.11% | 45,544 | 45.15% | 1,168 | 1.16% | 587 | 0.58% | 8,037 | 7.96% | 100,880 |
| Merrimack | 21,853 | 58.62% | 14,865 | 39.87% | 377 | 1.01% | 187 | 0.50% | 6,988 | 18.75% | 37,282 |
| Rockingham | 36,738 | 53.92% | 30,051 | 44.11% | 903 | 1.33% | 438 | 0.64% | 6,687 | 9.81% | 68,130 |
| Strafford | 14,569 | 49.61% | 14,566 | 49.60% | 50 | 0.17% | 180 | 0.61% | 3 | 0.01% | 29,365 |
| Sullivan | 6,679 | 50.57% | 6,323 | 47.88% | 137 | 1.04% | 68 | 0.51% | 356 | 2.69% | 13,207 |
| Total | 185,935 | 54.75% | 147,635 | 43.47% | 4,095 | 1.21% | 1,953 | 0.58% | 38,300 | 11.28% | 339,618 |
Counties that flipped from Republican to Democratic
See also
References
- ^ "1976 Presidential General Election Results - New Hampshire". Dave Leip's Atlas of U.S. Presidential Elections. Retrieved November 16, 2013.
- ^ Our Campaigns; NH US President Race, November 02, 1976


