2000 Salvadoran legislative election|
|
All 84 seats in the Legislative Assembly
43 seats needed for a majority |
|
This lists parties that won seats. See the complete results below.  Results by constituency |
|
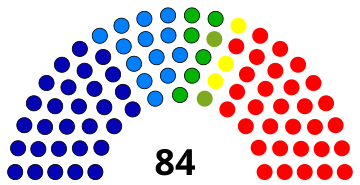
Legislative elections were held in El Salvador on 12 March 2000.[1] Although the Nationalist Republican Alliance received the most votes, the Farabundo Martí National Liberation Front won the most seats. Voter turnout was 42%.
Results
 |
|---|
| Party | Votes | % | Seats | +/– |
|---|
| Nationalist Republican Alliance | 436,169 | 36.04 | 29 | +1 |
| Farabundo Martí National Liberation Front | 426,289 | 35.22 | 31 | +4 |
| National Conciliation Party | 106,802 | 8.82 | 13 | +2 |
| Christian Democratic Party | 87,074 | 7.19 | 6 | –4 |
| United Democratic Centre | 65,070 | 5.38 | 3 | New |
| National Action Party | 44,901 | 3.71 | 2 | New |
| Social Christian Union | 23,329 | 1.93 | 0 | New |
| Liberal Democratic Party | 15,639 | 1.29 | 0 | –2 |
| Popular Labor Party | 4,996 | 0.41 | 0 | New |
| Total | 1,210,269 | 100.00 | 84 | 0 |
|
| Valid votes | 1,210,269 | 96.33 | |
|---|
| Invalid/blank votes | 46,073 | 3.67 | |
|---|
| Total votes | 1,256,342 | 100.00 | |
|---|
| Registered voters/turnout | 3,007,233 | 41.78 | |
|---|
| Source: Nohlen |
References
- ^ Dieter Nohlen (2005) Elections in the Americas: A data handbook, Volume I, p276 ISBN 978-0-19-928357-6
Bibliography
- Political Handbook of the world, 1997. New York, 1998.


