1936 United States presidential election in Maine
| ||||||||||||||||||||||||||
| ||||||||||||||||||||||||||
 County Results
| ||||||||||||||||||||||||||
| ||||||||||||||||||||||||||
| Elections in Maine |
|---|
 |
The 1936 United States presidential election in Maine was held on November 3, 1936 as part of the 1936 United States presidential election. The state voters chose five electors to the Electoral College, who voted for president and vice president.
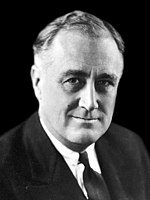
Maine voted for Republican Party candidate Alf Landon of Kansas, over Democratic Party candidate and incumbent President Franklin D. Roosevelt.
Landon won Maine by a margin of 13.97%, making it his best state in the Union, and with 55.49% of the popular vote, made it his second strongest state after nearby Vermont.[1] Landon achieved this despite losing two counties (Washington and York) that had voted for Herbert Hoover in 1932, as he made gains of up to ten percent in the rock-ribbed Yankee counties of Hancock, Lincoln and Waldo.
Maine had been one of only 6 states to vote to re-elect Hoover, the embattled incumbent Republican president, over FDR in the latter's 1932 landslide, and in 1936, it was one of only two states in the entire nation (along with nearby Vermont) to vote for Alf Landon over the wildly popular Roosevelt. Maine and Vermont ultimately would be the only states to reject FDR in all four of his presidential campaigns.
Results
| 1936 United States presidential election in Maine[2] | ||||||||
|---|---|---|---|---|---|---|---|---|
| Party | Candidate | Running mate | Popular vote | Electoral vote | ||||
| Count | % | Count | % | |||||
| Republican | Alf Landon of Kansas | Frank Knox of Illinois | 168,823 | 55.49% | 5 | 100.00% | ||
| Democratic | Franklin Delano Roosevelt of New York | John Nance Garner of Texas | 126,333 | 41.52% | 0 | 0.00% | ||
| Union | William Lemke of North Dakota | Thomas C. O'Brien of Massachusetts | 7,581 | 2.49% | 0 | 0.00% | ||
| Socialist | Norman Thomas of New York | George A. Nelson of Wisconsin | 783 | 0.26% | 0 | 0.00% | ||
| Prohibition | David Leigh Colvin of New York | Claude A. Watson of California | 334 | 0.11% | 0 | 0.00% | ||
| Communist | Earl Russell Browder of Kansas | James W. Ford of New York | 257 | 0.08% | 0 | 0.00% | ||
| Socialist Labor | John W. Aiken of Connecticut | Emil F. Teichert of New York | 129 | 0.18% | 0 | 0.00% | ||
| Total | 304,240 | 100.00% | 5 | 100.00% | ||||
Results by county
| County | Alfred Mossman Landon Republican |
Franklin Delano Roosevelt Democratic |
William Frederick Lemke[3] Union |
Various candidates Other parties |
Margin | Total votes cast[4] | |||||
|---|---|---|---|---|---|---|---|---|---|---|---|
| # | % | # | % | # | % | # | % | # | % | ||
| Androscoggin | 10,480 | 38.14% | 16,657 | 60.62% | 250 | 0.91% | 90 | 0.33% | -6,177 | -22.48% | 27,477 |
| Aroostook | 14,708 | 64.69% | 7,704 | 33.88% | 218 | 0.96% | 106 | 0.47% | 7,004 | 30.81% | 22,736 |
| Cumberland | 30,021 | 55.56% | 22,895 | 42.37% | 904 | 1.67% | 210 | 0.39% | 7,126 | 13.19% | 54,030 |
| Franklin | 4,957 | 62.53% | 2,859 | 36.06% | 82 | 1.03% | 30 | 0.38% | 2,098 | 26.47% | 7,928 |
| Hancock | 9,151 | 72.06% | 3,315 | 26.10% | 187 | 1.47% | 47 | 0.37% | 5,836 | 45.96% | 12,700 |
| Kennebec | 14,987 | 55.34% | 11,268 | 41.61% | 706 | 2.61% | 120 | 0.44% | 3,719 | 13.73% | 27,081 |
| Knox | 6,567 | 60.36% | 3,991 | 36.69% | 252 | 2.32% | 69 | 0.63% | 2,576 | 23.67% | 10,879 |
| Lincoln | 5,252 | 72.62% | 1,850 | 25.58% | 87 | 1.20% | 43 | 0.59% | 3,402 | 47.04% | 7,232 |
| Oxford | 8,778 | 57.13% | 5,836 | 37.98% | 619 | 4.03% | 133 | 0.87% | 2,942 | 19.15% | 15,366 |
| Penobscot | 19,077 | 60.82% | 9,732 | 31.03% | 2,318 | 7.39% | 241 | 0.77% | 9,345 | 29.79% | 31,368 |
| Piscataquis | 4,057 | 55.61% | 3,051 | 41.82% | 151 | 2.07% | 36 | 0.49% | 1,006 | 13.79% | 7,295 |
| Sagadahoc | 3,707 | 51.99% | 3,273 | 45.90% | 125 | 1.75% | 25 | 0.35% | 434 | 6.09% | 7,130 |
| Somerset | 7,558 | 56.91% | 5,282 | 39.77% | 334 | 2.51% | 107 | 0.81% | 2,276 | 17.14% | 13,281 |
| Waldo | 5,309 | 64.97% | 2,678 | 32.77% | 159 | 1.95% | 26 | 0.32% | 2,631 | 32.20% | 8,172 |
| Washington | 6,387 | 44.06% | 7,925 | 54.67% | 129 | 0.89% | 54 | 0.37% | -1,538 | -10.61% | 14,495 |
| York | 17,827 | 48.09% | 18,017 | 48.60% | 1,060 | 2.86% | 166 | 0.45% | -190 | -0.51% | 37,070 |
| Totals | 168,823 | 55.49% | 126,333 | 41.52% | 7,581 | 2.49% | 1,503 | 0.49% | 42,490 | 13.97% | 304,240 |
Counties that flipped from Republican to Democratic
See also
- United States presidential elections in Maine
- 1936 United States presidential election in Vermont - Alf Landon's other sole win in 1936
References
- ^ "1936 Presidential Election Statistics". Dave Leip’s Atlas of U.S. Presidential Elections. Retrieved March 5, 2018.
- ^ "1936 Presidential General Election Results - Maine". U.S. Election Atlas. Retrieved December 23, 2013.
- ^ Géoelections; 1936 Presidential Election Popular Vote (.xlsx file for €15 on request)
- ^ Scammon, Richard M. (compiler); America at the Polls: A Handbook of Presidential Election Statistics 1920-1964; p. 203 ISBN 0405077114


